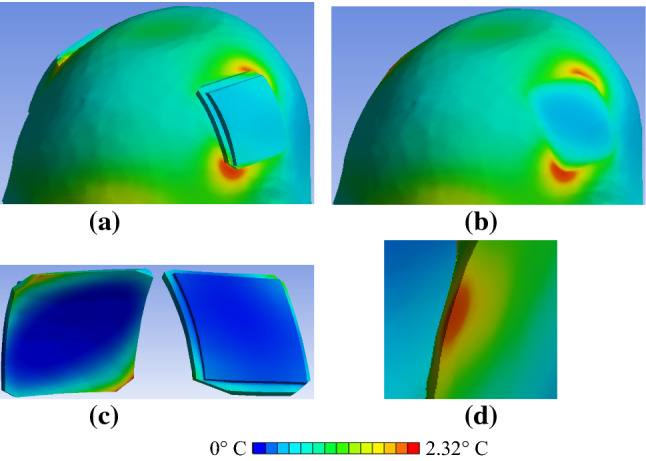
Fig. 9.

Close-up view of ΔT distributions in the human model in close proximity to tES electrode and gel patch with chamfered corners after 540 s of RF exposure for anatomical model A × s0.5 × f × c × 1. a ΔT distribution in the skin, electrodes and gel patches. b ΔT distribution in the skin (electrodes and gel patches not shown). c ΔT distribution in the electrodes and gel patches (head not shown). d ΔT distribution in the head cut at the location of highest skin heating and in close proximity to the electrode
