Fig. 3.
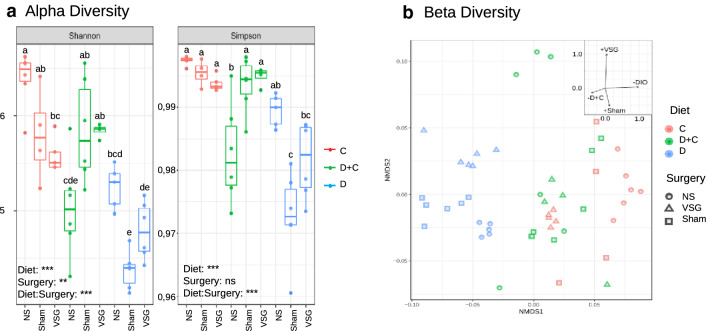
Diversity measures. a Shannon and Simpson indices showing sample alpha diversity. The bottom and top of the boxplot indicate the first and third quartile, whilst the line inside the box show the median. Diversity was reduced by both Sham surgery and VSG in all groups. D samples had the lowest diversity except for D + C-NS in the NS situation. P values < 0.001 (***), P values < 0.01 (**) and a–c correspond for significantly different groups (Tukey post-test). b Beta diversity. The non-metric Multidimensinal Scaling (NMDS) plot for the bacterial communities in our samples based on Bray–Curtis dissimilarities. D groups, C-NS and C-VSG formed distinct clusters. PERMANOVA analysis: Surgery (P < 0.001), Diet (P < 0.001). D + C samples formed less defined clusters, but were very distinct from D samples and were overlapping the C-VSG and C-Sham groups

