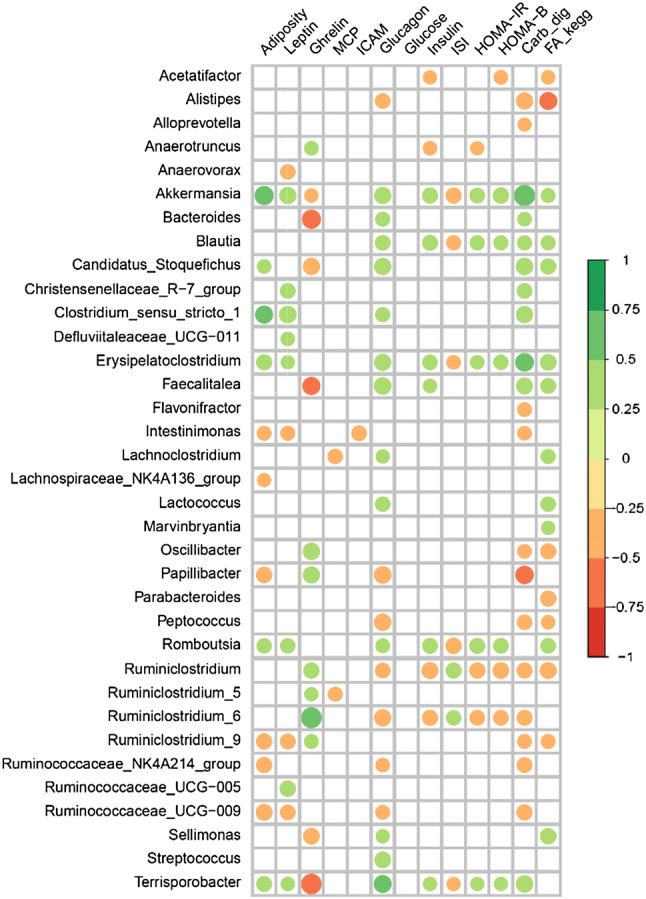
Fig. 5.

Graphic representation of the Spearman correlation coefficients between the significantly altered genera obtained by DESeq and different parameters such as adiposity index, biochemical parameters, and KEGG pathways. Positive correlations are shown in green color and negative correlations in red color. The color intensity and the circle size are proportional to the correlation coefficients. Only genera with significant correlations (< 0.05) are shown
