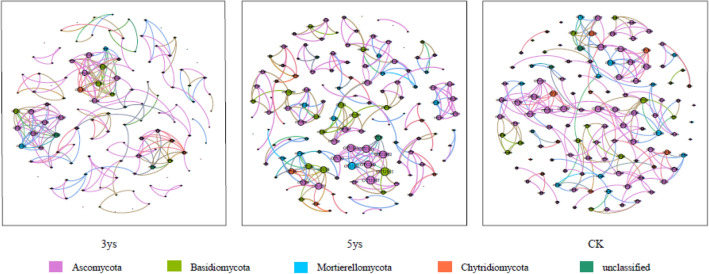
Figure 5.
The co-occurrence network of soil fungi based correlation analysis. A connection stands for a strong (Spearman’s ρ > 0.6) and significant (P < 0.01) correlation. The nodes represent unique OTUs. The size of each node is proportional to degree. The nodes colored by taxonomy. 3ys: continuous cropping of flue-cured tobacco for 3 years. 5ys: continuous cropping of flue-cured tobacco for 5 years. CK: flue-cured tobacco cropping for 1 year.

