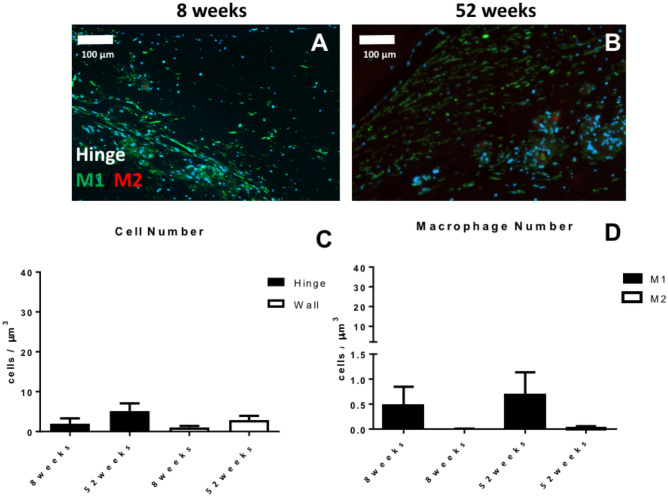
Figure 6.
Analysis of cell phenotype for the hinge area of second-generation TEHVs. Immunofluorescence images at the hinge area stained for M1 (green) and M2 (red) macrophages at 8 weeks (A) and 52 weeks (B) follow-up. (C) Total cell number quantification in the wall and hinge region of second-generation TEHVs. (D) Quantification of M1 and M2 macrophages in the hinge region at the different time-points considered shows a mild prevalence of M1 over M2 positive cells. For immunofluorescence pictures: scale bars: 100 μm, zoom 1 × . For every measurement, cell number is normalized per μm3.

