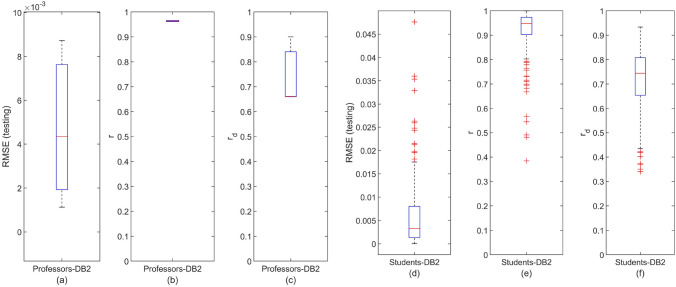
Figure 6.
Distribution of the DeepLMS predictive performance indices across users’ groups of DB2. (a) Box-plot of the distribution of RMSE between the testing and the estimated QoI data for the case of DB2 Professors, (b) box-plot of the distribution of the correlation coefficient r between the testing and the estimated QoI data for the case of DB2 Professors, (c) box-plot of the distribution of the correlation coefficient between the derivative of the testing and the derivative of the estimated QoI data for the case of DB2 Professors; (d–f) same as (a–c), respectively, yet for the case of DB2 Students. Additional DeepLMS predictive performance indices are tabulated in Table 1.

