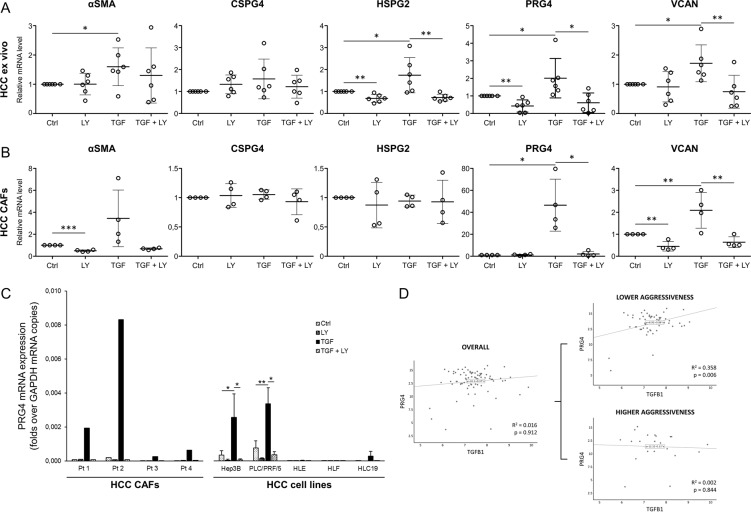
Fig. 2. TGFβ induces PRG4 expression in ex vivo cultured patients-derived HCC tumor samples, HCC CAFs, and cancer cells.
HCC patient-derived tumor specimens, CAFs and cancer cell lines were incubated for 48 hours in serum-free condition in the presence of DMSO, LY2157299 (LY, 10 µM), TGFβ1 (TGF, 5 ng/ml) + DMSO (diluted to 1:1000), or TGF + LY. Medium was replaced and treatments renewed at the 24 hours’ intermediate time point. mRNA expression levels of αSMA, PRG4, and other PGs were evaluated by qPCR. a Effect of TGFβ and/or LY2157299 on mRNA expression of αSMA, PRG4, and other PGs in ex vivo cultured patients-derived HCC tissues (N = 6 patients). Changes in αSMA mRNA expression were used as TGFβ response readout. b Effect of TGFβ and/or LY2157299 on mRNA expression of αSMA, PRG4, and other PGs in patients-derived HCC CAFs (N = 4 patients). Changes in αSMA mRNA expression were used as TGFβ response readout. c Comparison between raw levels of PRG4 mRNA expression of CAFs from four HCC patients (Pt 1–4) and five HCC cell lines in both basal condition, and in response to TGFβ and/or LY2157299 treatment. Data of HCC cells are from three independent experiments. d Correlation between mRNA expression indexes of TGFβ1 and PRG4 in HCC tumors (N = 78 patients). Tumor mRNA expression indexes of any specific marker used for plot generation represent the net tumor expression scores obtained by subtracting the non-tumor mRNA expression value from the corresponding value in matched tumor tissue in each patient. Data are expressed as the means ± SD (normalized to controls in a and b). GAPDH was used as housekeeping gene. T test (a–c; paired, one-tailed): *p < 0.05; **p < 0.01; ***p < 0.001. Log-rank test d.

