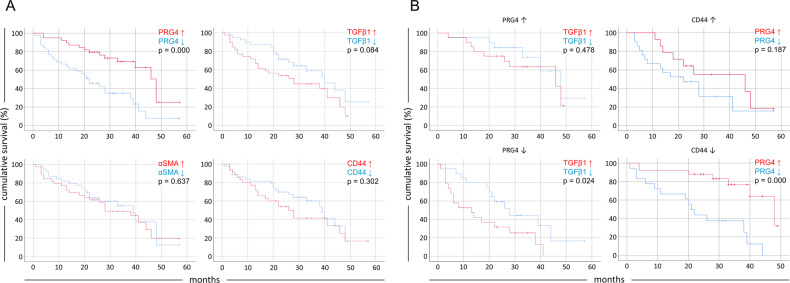
Fig. 3. Tumor expression of PRG4 is correlated with a better prognosis in HCC patients with concomitant lower tumor CD44 expression levels.
Kaplan–Meier curves showing the cumulative survival rate of 78 HCC cases. Patients are stratified into cohorts according to tumor mRNA expression indexes of each marker above or below the median values. Tumor mRNA expression indexes of any specific marker used for the generation of Kaplan–Meier curves represent the net tumor expression scores obtained by subtracting the non-tumor mRNA expression value from the corresponding value in matched tumor tissue in each patient. a Survival curves of patients expressing high or low mRNA levels of each marker. Note that the PRG4 chart in this panel is the corresponding chart of Fig. 1a, reused here for comparison purposes. b Survival curves of subsets of patients according to high or low PRG4 (left) and CD44 (right) tumor mRNA expression indexes.

