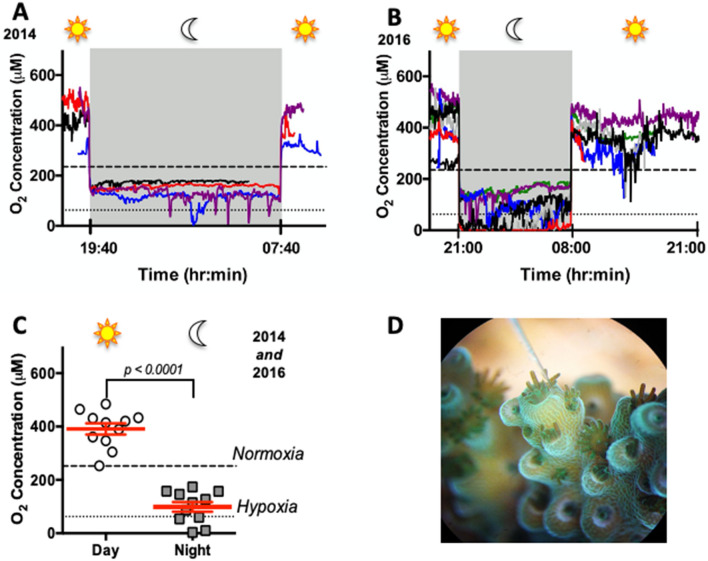
Figure 1.
O2 concentration in the coral diffusive boundary layer (DBL) throughout a diel cycle. (A) Continuous [O2] measurements in the DBL of coral branches from the 2014 experiment (n = 4). (B) Same as in A, but from the 2016 experiment (n = 7). (C) Average [O2] in the coral DBL during day and night. The white circles and grey squares show the average [O2] measurements for each coral branch during day and night, and the red lines represent mean ± SEM. Two-tailed paired t-test, n = 11 coral branches measured during 2014 and 2016. The dashed and dotted lines show normoxic [O2] in the tank (235 μM) and nominal hypoxia (62.5 μM), respectively. (D) Picture of an O2 microsensor in the DBL of an A. yongei branch taken through a dissecting scope (photo credit: L.B. Linsmayer).

