Figure 6.
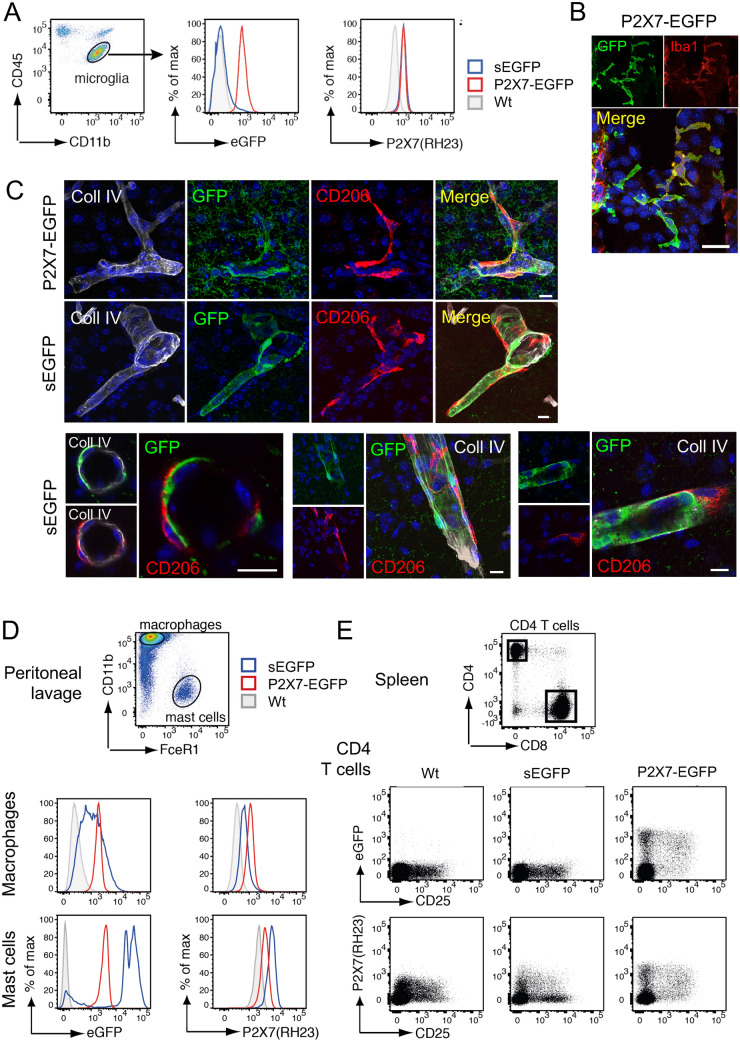
Comparison of EGFP expression in immune cells of the brain. (A) Brain microglia (CD11bCD45low) from wt and BAC transgenic mice were analysed by flow cytometry for endogenous EGFP expression and cell surface P2X7 expression using a monoclonal antibody (clone RH23A44). (B) Immunofluorescence staining of Iba1 and EGFP in the third ventricle of the P2X7-EGFP mouse. Scale bar: 25 μm. (C) Comparison of perivascular macrophage staining in sEGFP and P2X7-EGFP mice. Anti-collagen IV antibody was used to stain blood vessels and CD206 was used as a marker for perivascular macrophages. Lower panel: detailed images from the sEGFP mouse showing a lack of overlap between EGFP and CD206 staining. Scale bar:10 µm, DAPI staining in blue. (D) Peritoneal macrophages (CD11b+FceR1–) and mast cells (CD11b–FceR1+) from wt and BAC transgenic mice were analysed by flow cytometry for endogenous EGFP expression and cell surface P2X7 expression. (E) CD4+ T cells from the spleen wt and BAC transgenic mice were analysed by flow cytometry for endogenous EGFP expression and cell surface P2X7 expression. EGFP and P2X7 expression levels were compared on helper T cells (CD4+CD25–) and regulatory T cells (CD4+CD25+).

