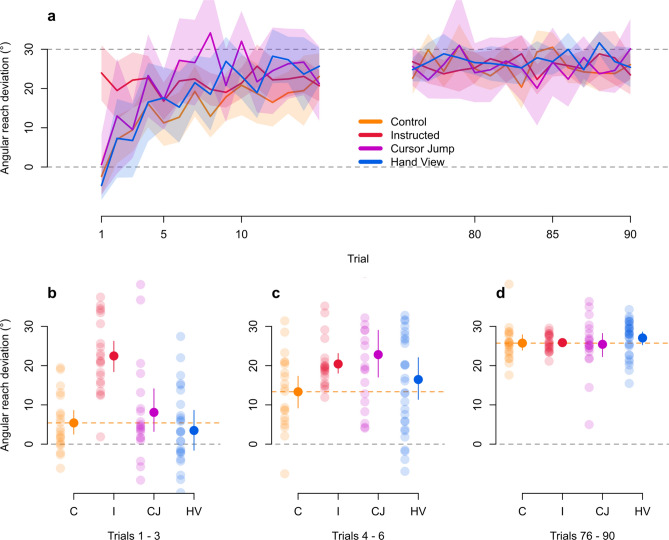
Figure 3.
Rate of learning during adaptation training. (a) Only the first and last 15 trials of adaptation training are shown. Grey dashed line at the 30° mark indicates the direction that the hand must deviate in order to fully and successfully counter for the perturbation. The grey dashed line at the 0° mark indicates reach directions similar to those in the baseline, aligned session (i.e., no compensation). The Instructed group shows an initial advantage in successfully countering for the perturbation as early as the first trial. There are no differences in reaches performed by participants from all groups for the last 15 trials. Solid lines are group means and shaded regions are corresponding 95% confidence intervals. (b–d) Individual participant data from each group are shown, separated in three blocks of trial sets during adaptation training. Orange dashed line indicates mean for the Control group. Solid dots and error bars correspond to the group mean and bootstrapped 95% confidence intervals.

