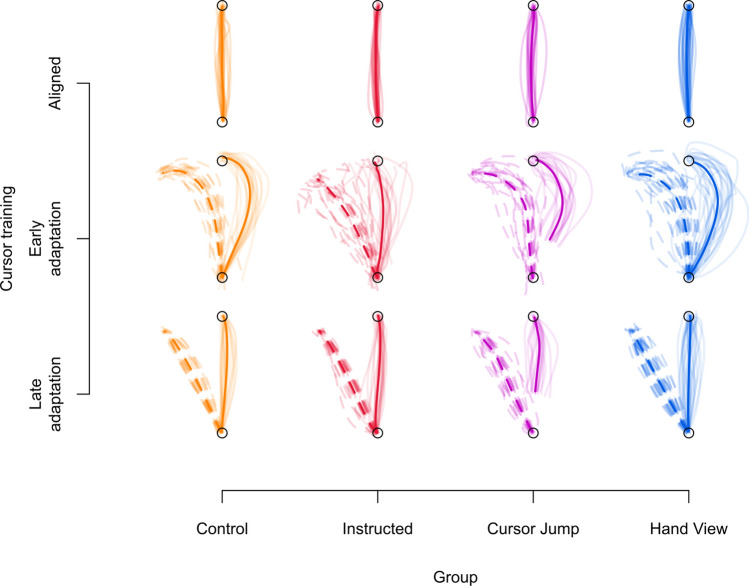
Figure 4.
Individual and average reach trajectories. The trajectory of reaches across all participants within their respective groups are shown with light coloured lines. Each participant’s trajectory combines reaches during the last three trials of the first block of cursor training in the aligned session (top), as well as the first (middle) and last three (bottom) trials of the first block of cursor training in the rotated session. Light solid lines indicate the trajectory of the hand-cursor and light dashed lines indicate the trajectory of the hand. Only solid lines are shown in the aligned session, as both hand and hand-cursor trajectories are similar. Group means for the hand trajectories are indicated with the dark dashed line, and dark solid lines indicate the mean hand-cursor trajectory. All groups seem to produce similar reach trajectories, across the different time points in the experiment, regardless of condition. Moreover, despite curved reaches during early adaptation training, reach trajectories are straight towards the end of adaptation training.

