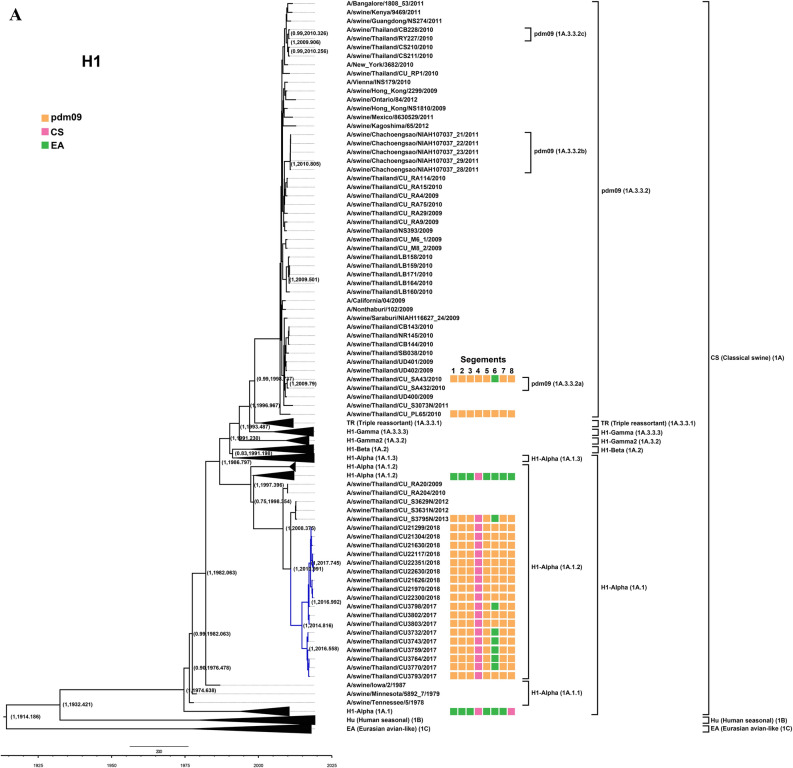
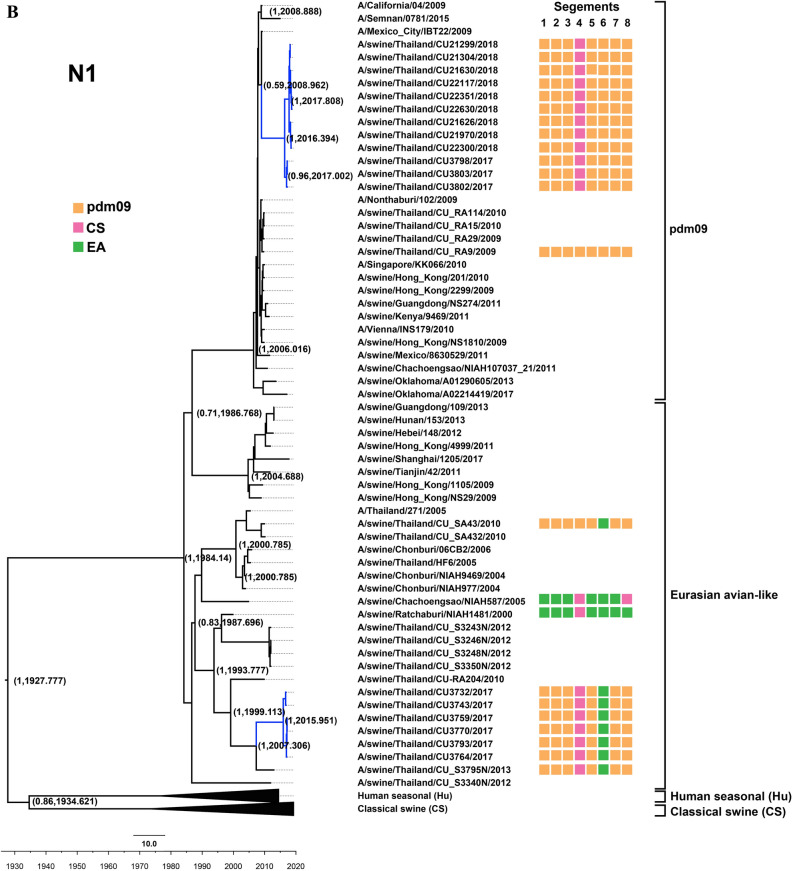
Figure 1.
(A) Phylogenetic tree of H1 of S-IAV-H1N1. (B) Phylogenetic tree of N1 of S-IAV-H1N1. Yellow, pink, and green colors indicate pdm2009-H1N1 lineage (pdm09), classical swine lineage (CS), Eurasian avian-like lineage (EA), respectively. Circles indicate S-IAV-H1N1 isolated in this study. The phylogenetic tree was constructed by using the Beast program with Bayesian Markov‐Chain Monte Carlo (BMCMC), with 50,000,000 generations and an average standard deviation of split frequencies < 0.10. Values on branches represent posterior probability and times of most recent common ancestor (TMRCA) among H1-S-IAV.


