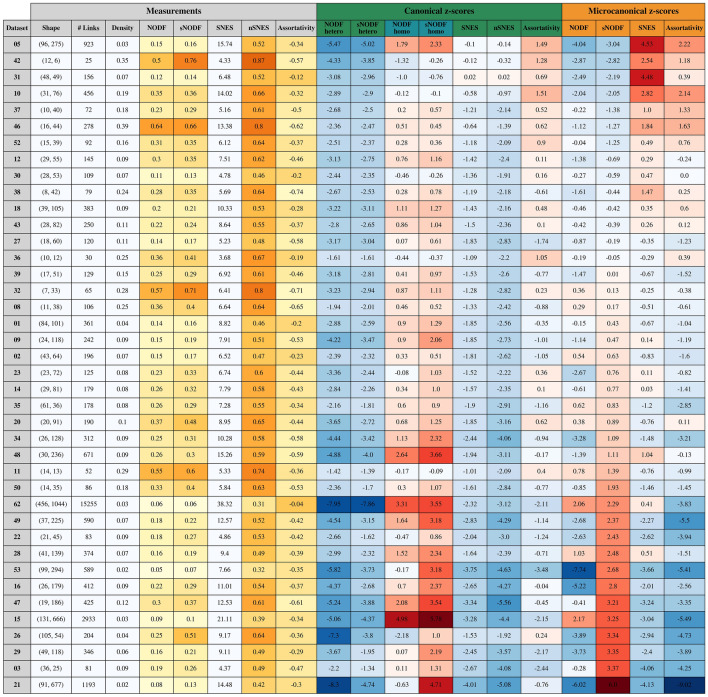
Figure 3.
Measures and z-scores of each of the networks in the Web of Life pollination binary dataset, ordered according to the sNODF microcanonical z-scores. The microcanonical z-scores of the nSNES are omitted because they are identical to the SNES ones. The colour scales have been normalised linearly in the respective measures’ domains for the measures, while for the z-scores there is a unique colour scale, blue for the negative and red for the positive scores. The SNES measure does not have a colour scale since they are not comparable given the different sizes.

