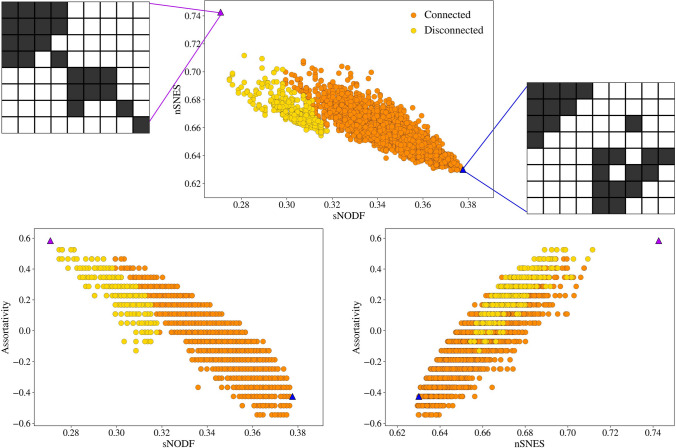
Figure 6.
Top: a sample from the microcanonical configuration model ensemble with the relative scores of nSNES and sNODF. Bottom: the same sample with scores of sNODF against assortativity (left), nSNES against assortativity (right). Different colours are used for sampled networks that result connected or disconnected. The highlighted networks have high values of nSNES or sNODF, and show that for their extreme values, the systems can be disconnected (left) or barely connected (right). The left matrix, with a high nSNES, has a really assortative configuration, while the right one has a high sNODF and is highly disassortative. We do not exclude disconnected networks in our analysis since it could be a possible configuration for an ecological system.

