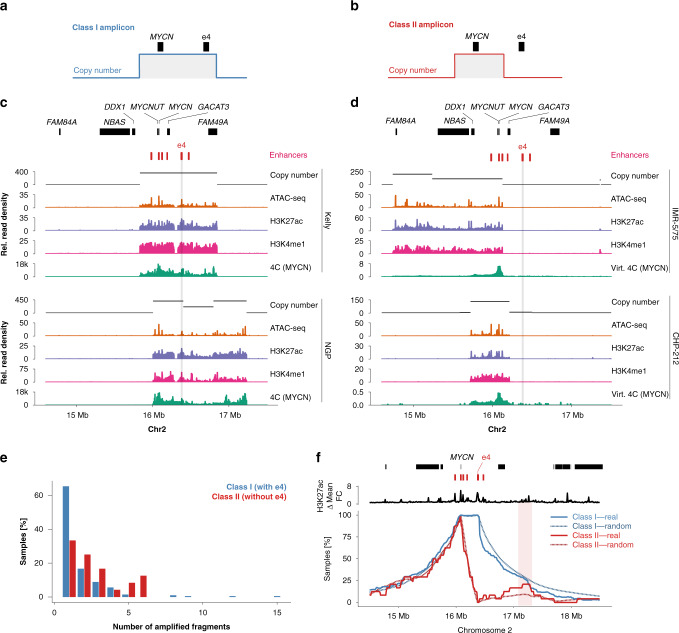
Fig. 3. Two classes of MYCN amplicons can be identified in neuroblastoma.
Schematic representation of class I (a) and class II (b) MYCN amplicons. c Copy-number profile (black), ATAC-seq (orange), H3K27ac ChIP-seq (purple), H3K4me1 ChIP-seq (pink), and 4C (MYCN promoter as the viewpoint; green) for two neuroblastoma cell lines with class I amplicons, co-amplifying the e4. d Copy-number profile (black), ATAC-seq (orange), H3K27ac ChIP-seq (purple), H3K4me1 ChIP-seq (pink), and virtual 4C (MYCN locus as the viewpoint; green) for two neuroblastoma cell lines class II amplicons, not co-amplifying e4. e Number of non-contiguous amplified fragments in class I samples (N = 216) vs. class II samples (N = 24). f Amplicon boundary frequency relative to gene and enhancer positions in class I vs. class II amplicons compared to random amplicon boundary frequencies. Source data are provided as a Source Data file.

