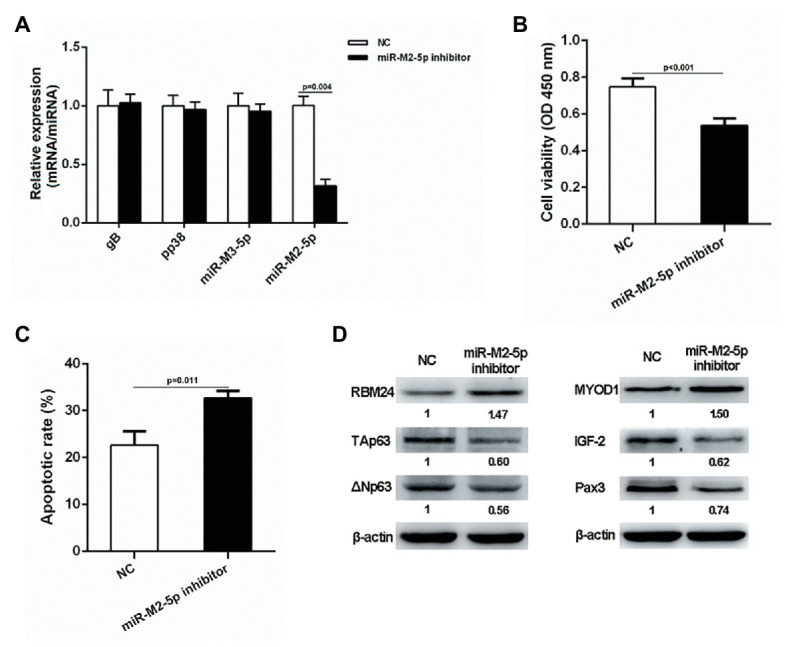
Figure 8.

Proliferation and apoptosis of miR-M2-5p inhibitor-transfected MSB-1 cells. (A) RT-qPCR analysis of the relative expression levels of viral protein-coding or miRNA genes in MSB-1 cells at 24 hpt with miR-M2-5p inhibitor. (B,C) Cell viability and apoptosis of the MSB-1 cells transfected with miR-M2-5p inhibitor. MSB-1 cells transfected with miR-M2-5p inhibitor were harvested at 24 hpt for Annexin V-FITC and propidium iodide (PI) staining for apoptosis analysis using flow cytometry. CCK-8 assay was used to assess cell viability. (D) Western blot analysis of proteins associated with the cell proliferation or apoptosis in MSB-1 cells at 24 hpt. Numbers below the blots indicate relative band intensity normalized to β-actin. Error bars are derived from three independent replicates. Values of p indicated on columns were used for statistical analyses; ns, no significance.
