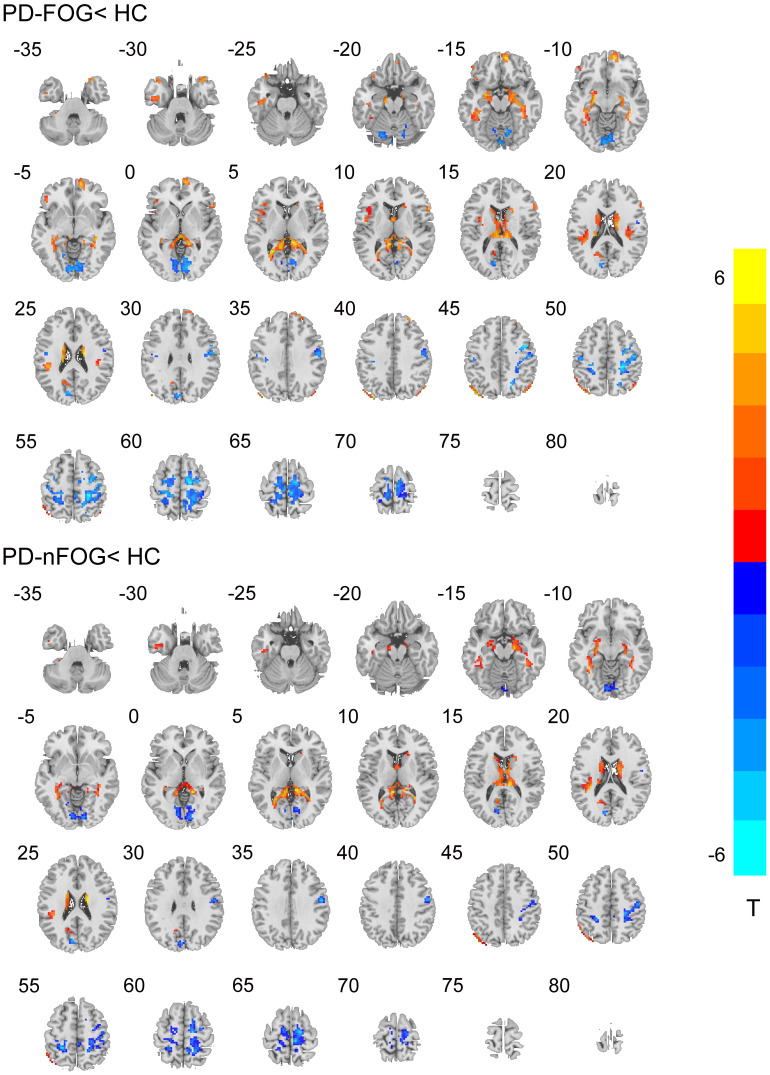
FIGURE 1.
Degree centrality (DC) result maps of the comparison between patients and healthy control (HC) groups on axial images (p < 0.001, AlphaSim corrected). The left side of the image corresponds to the left side of the brain in axial orientation. Slice coordinates according to the Montreal Neurological Institute (MNI) space are shown on the upper left corner of the slices, indicating the Z-axis in axial orientation. The t-value scale is seen to the right of the image.

