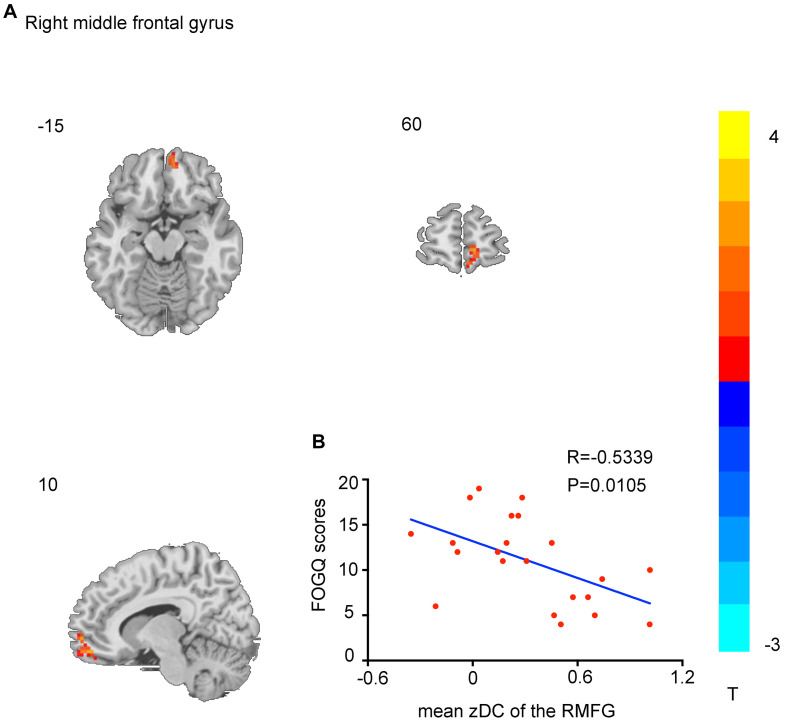
FIGURE 2.
Brain regions showing DC differences between Parkinson’s disease with freezing of gait (PD-FOG) and PD patients without FOG (PD-nFOG) groups. Only right middle frontal gyrus (RMFG) had decreased DC (p < 0.001, AlphaSim-corrected). The t-value scale is seen to the right of the image (A). The scatter plot shows the negative correlation between RMFG DC values and Freezing of Gait Questionnaire (FOGQ) scores in PD-FOG patients (B).

