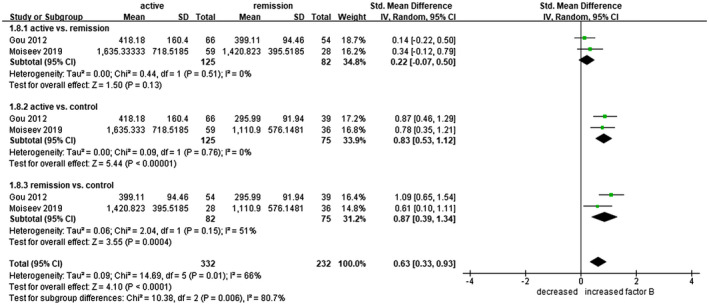
Fig. 4.

Forest plot of random‐effects meta‐analysis of factor B levels. 1.8.1 = Anti‐neutrophil cytoplasmic antibody‐associated vasculitis (AAV) patients in active state versus in remission; 1.8.2 = active AAV patients versus healthy controls; 1.8.3 = AAV patients in remission versus healthy controls. Squares are proportional to study weight.
