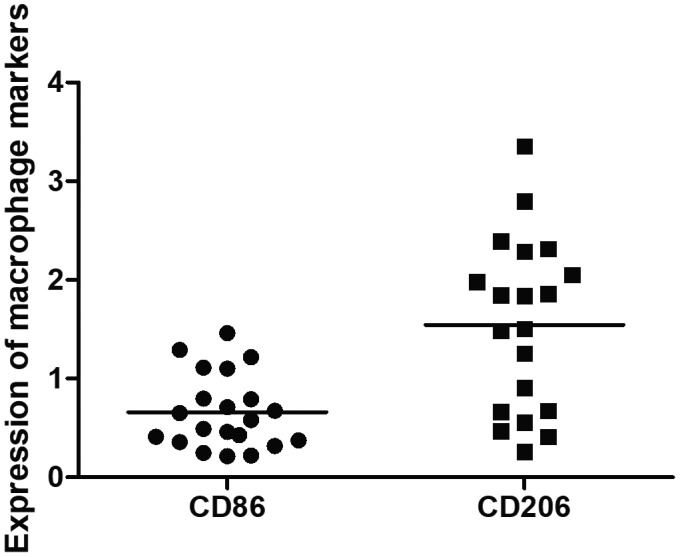
Fig. 4.

M1 and M2 macrophage markers in the aorta from Takayasu arteritis (TAK) patients. CD206 versus CD86: 1·672 (0·667–2·230) versus 0·581 (0·366–0·949); P = 0·0007. The crossbar represents the mean expression of macrophage markers. Data were presented as median and interquartile range and the analysis was performed by the Mann–Whitney U‐test.
