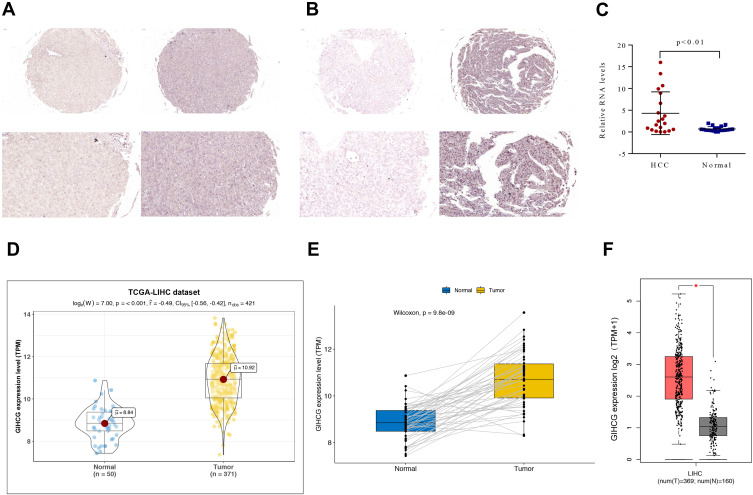
Figure 1.
GIHCG expression in HCC and normal liver samples. (A and B) Representative photos (magnification: 20× and 40×) of GIHCG expression in adjacent normal liver tissues (A) and HCC (B) tissues. (C) GIHCG expression was examined by qRT-PCR in 20 paired HCC tissues and adjacent normal liver tissues. (D and E) Comparison of GIHCG expression in HCC and normal liver using the TCGA-LIHC cohort containing 371 HCC samples and 50 paired adjacent normal liver tissue samples as shown in Panel B; (F) Comparison expression of GIHCG in HCC (TCGA-LIHC: 369 HCC samples, excluding 2 repeated patients) and normal liver (GETx: 160 donation liver samples).

