Figure 3.
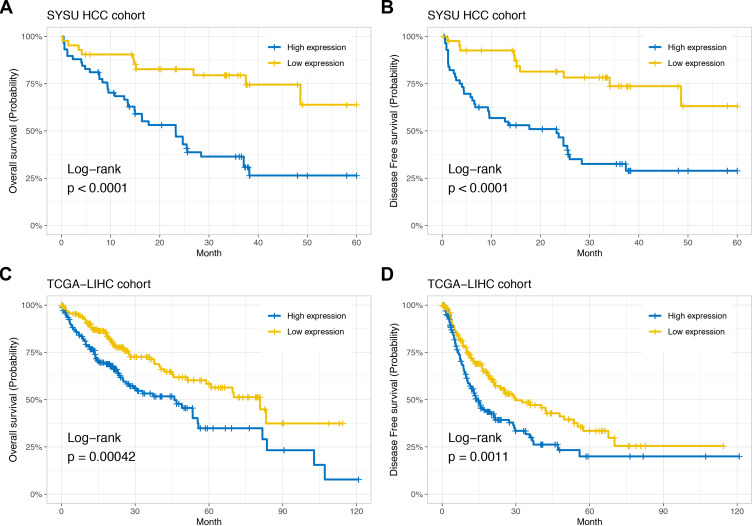
High GIHCG expression is associated with poor prognosis. Kaplan-Meier curves show overall survival (A) and disease-free survival (B) curves for 58 GIHCG high-expression patients and 42 GIHCG low-expression patients in the SYSU HCC cohort. Kaplan-Meier plots show overall survival (C) and disease-free survival (D) curves for 185 GIHCG high-expression patients and 186 GIHCG high-expression patients from the TCGA-LIHC cohort.

