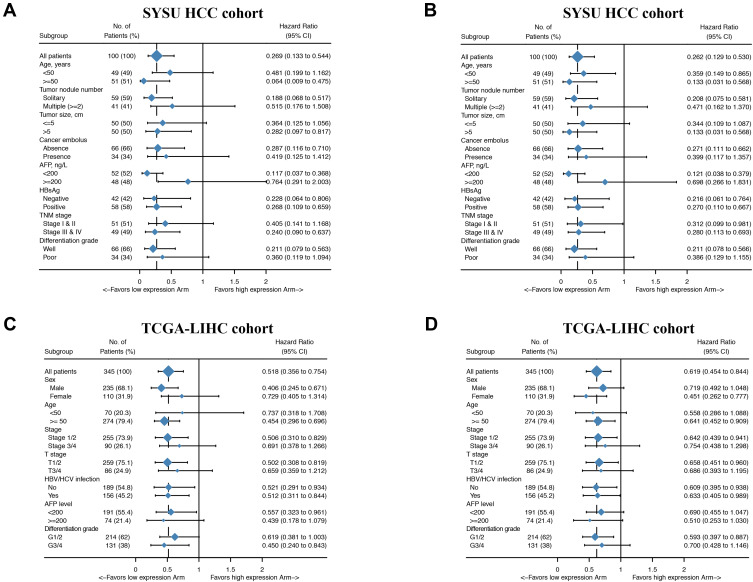
Figure 4.
Hazard ratio values for subgroup analyses of GIHCG expression in HCC patients. Forest plots summarizing the hazard ratio (HR) between GIHCG expression and survival in HCC patients as analyzed by the different clinicopathological subgroups. (A) HR values for OS in the SYSU HCC cohort. (B) HR values for DFS in the SYSU HCC cohort. (C) HR values for OS in the TCGA-LIHC cohort. (D) HR values for DFS in the TCGA-LIHC cohort.

