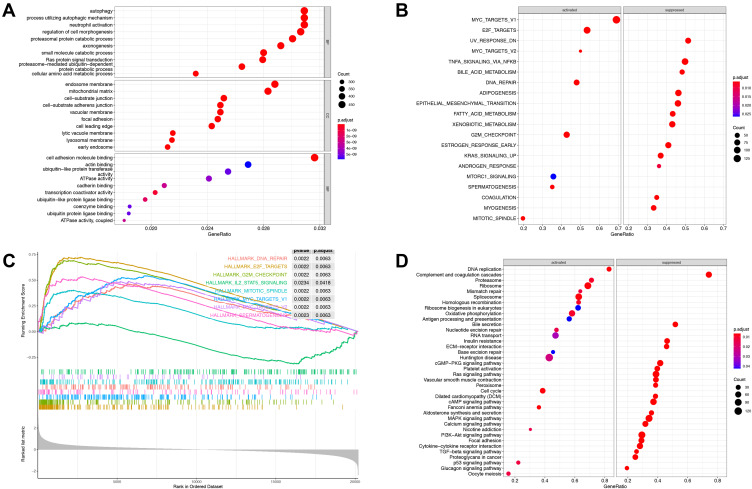
Figure 5.
Gene set enrichment analysis between GIHCG high- and low-expression groups. (A) Gene Ontology enrichment analysis includes biological processes, cellular components and molecular function. (B) Enriched hallmark terms correlated to GIHCG expression. (C) Representative hallmark terms enrichment plot. (D) GSEA-based Kyoto Encyclopedia of Genes and Genomes (KEGG) analysis revealed the enriched activated and suppressed pathways between the GIHCG high- and low- expression groups. The circle size indicates the counts of enriched terms and the color represents the P value.

