
Fig. 6.
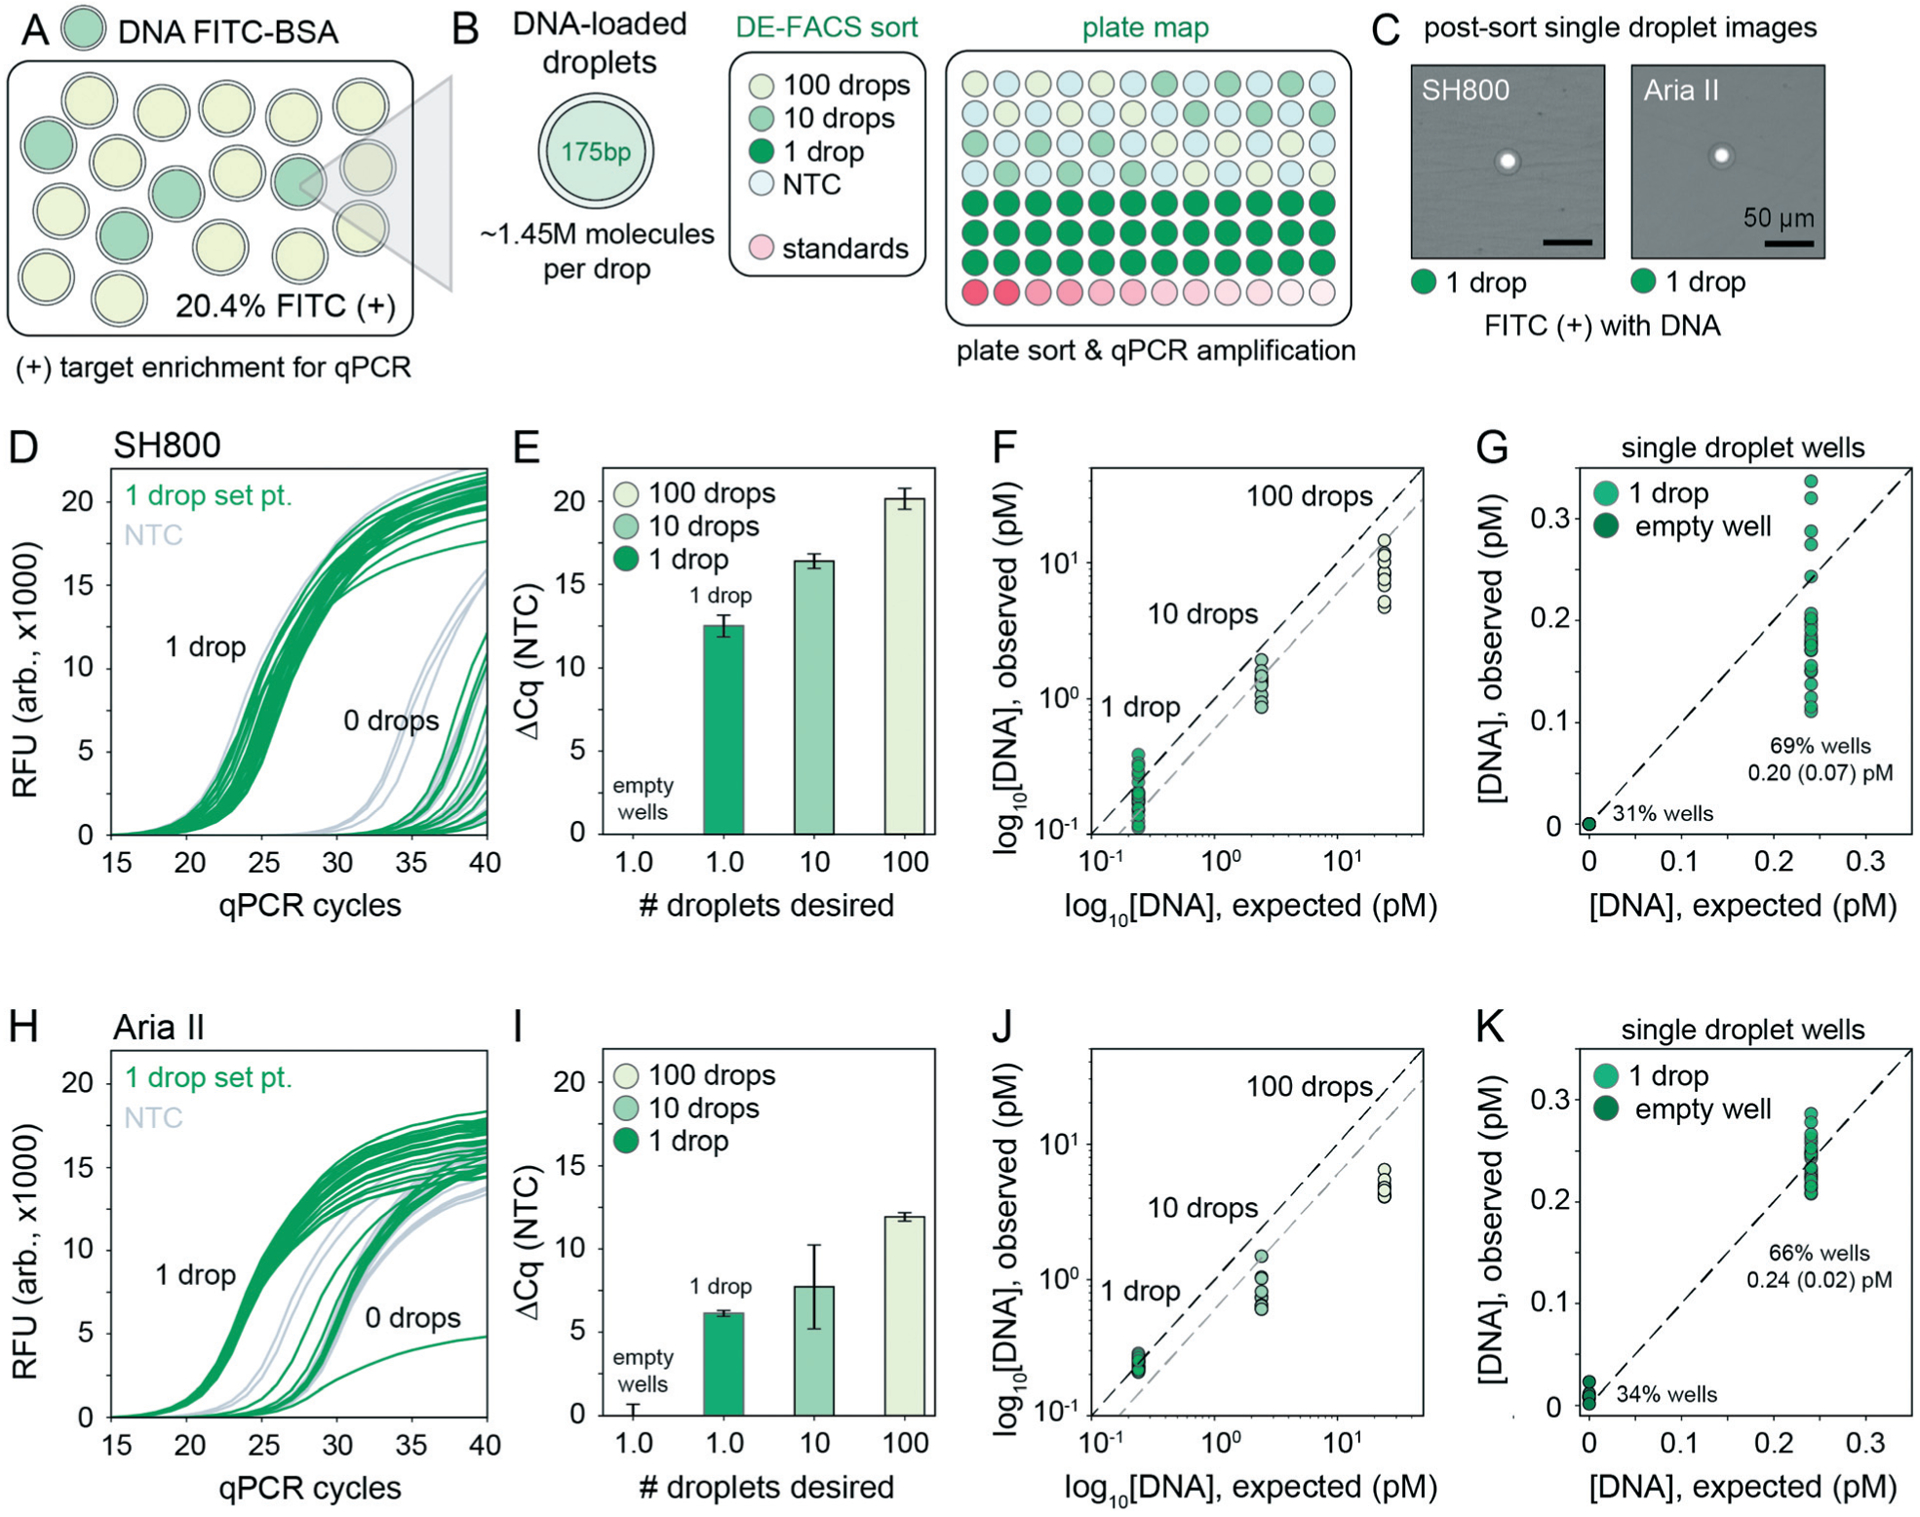
Downstream nucleic acid recovery and qPCR processing of DE droplets with sdDE-FACS. (A) Mixed populations containing DNA-loaded DEs labelled with FITC–BSA in a pool of blank droplets. (B) Plate map schematic for the qPCR assay (10 μL reactions). (C) Optical confirmation of post-sort enrichment for the SH800 and Aria II on single droplet wells. (D and H) Raw qPCR traces for single droplet wells (n = 36 wells per plate) for the SH800 and Aria II, respectively. (E and I) Cycling thresholds (NTC subtracted) for all droplet-designated wells for the SH800 and Aria II. (F and J) Absolute quantification using in-plate DNA standards for 100, 10, and 1 droplet per well set points with further analysis of single droplet designated wells, (G and K), as clustered by bimodal sorting statistics for the SH800 and Aria II, respectively. Mean (SD) recovered DNA concentrations are indicated; expected concentration is 0.24 pM per well. Each point represents an individual well measurement.