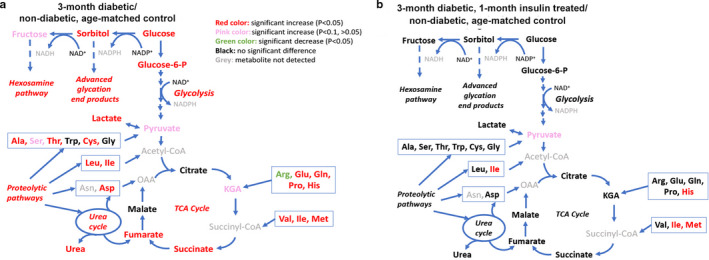
Figure 1.

Comparison of changes in detrusor metabolite levels of major energy‐generating pathways between (a) 3‐month diabetic versus non‐diabetic, age‐matched controls and (b) 3‐month diabetic, 1‐month insulin‐treated versus non‐diabetic, age‐matched controls. For each animal group metabolite levels were determined inN = 5 animals. The following color code was used for a difference in metabolite level compared to the non‐diabetic, age‐matched control: red = fold‐change >1,p < .05; pink = fold‐change >1,p < .1; dark green = fold‐change <1,p < .05; black = no significant difference; grey = metabolite not detected
