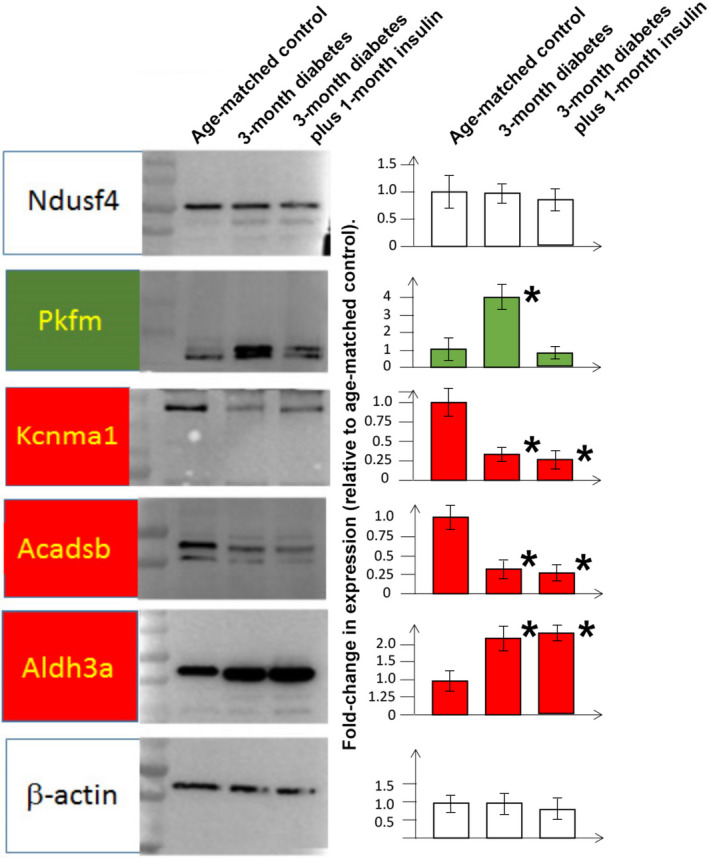
Figure 3.

Protein expression in bladder detrusor in non‐diabetic, age‐matched controls, 3‐month diabetic, 3‐month diabetic plus one‐month insulin treatment. Left panel: Representative immunoblots are shown for proteins chosen based on the results in Supplemental Table S2 as representing genes in loci where the methylation pattern was changed in diabetic animals, but reversed (highlighted with green background), or not reversed (highlighted with red background), following insulin treatment. White background represents genes that are in loci where the methylation pattern was not changed with diabetes. Right panel: Bars represent the average fold‐change in protein expression compared to non‐diabetic, age‐match controls (N = 3 animals per group) determined by densitometric analysis of Western blots normalized to the housekeeping gene, β‐actin. * = significant difference (p < .05) in protein expression compared to non‐diabetic, age‐matched controls
