
Figure 5.
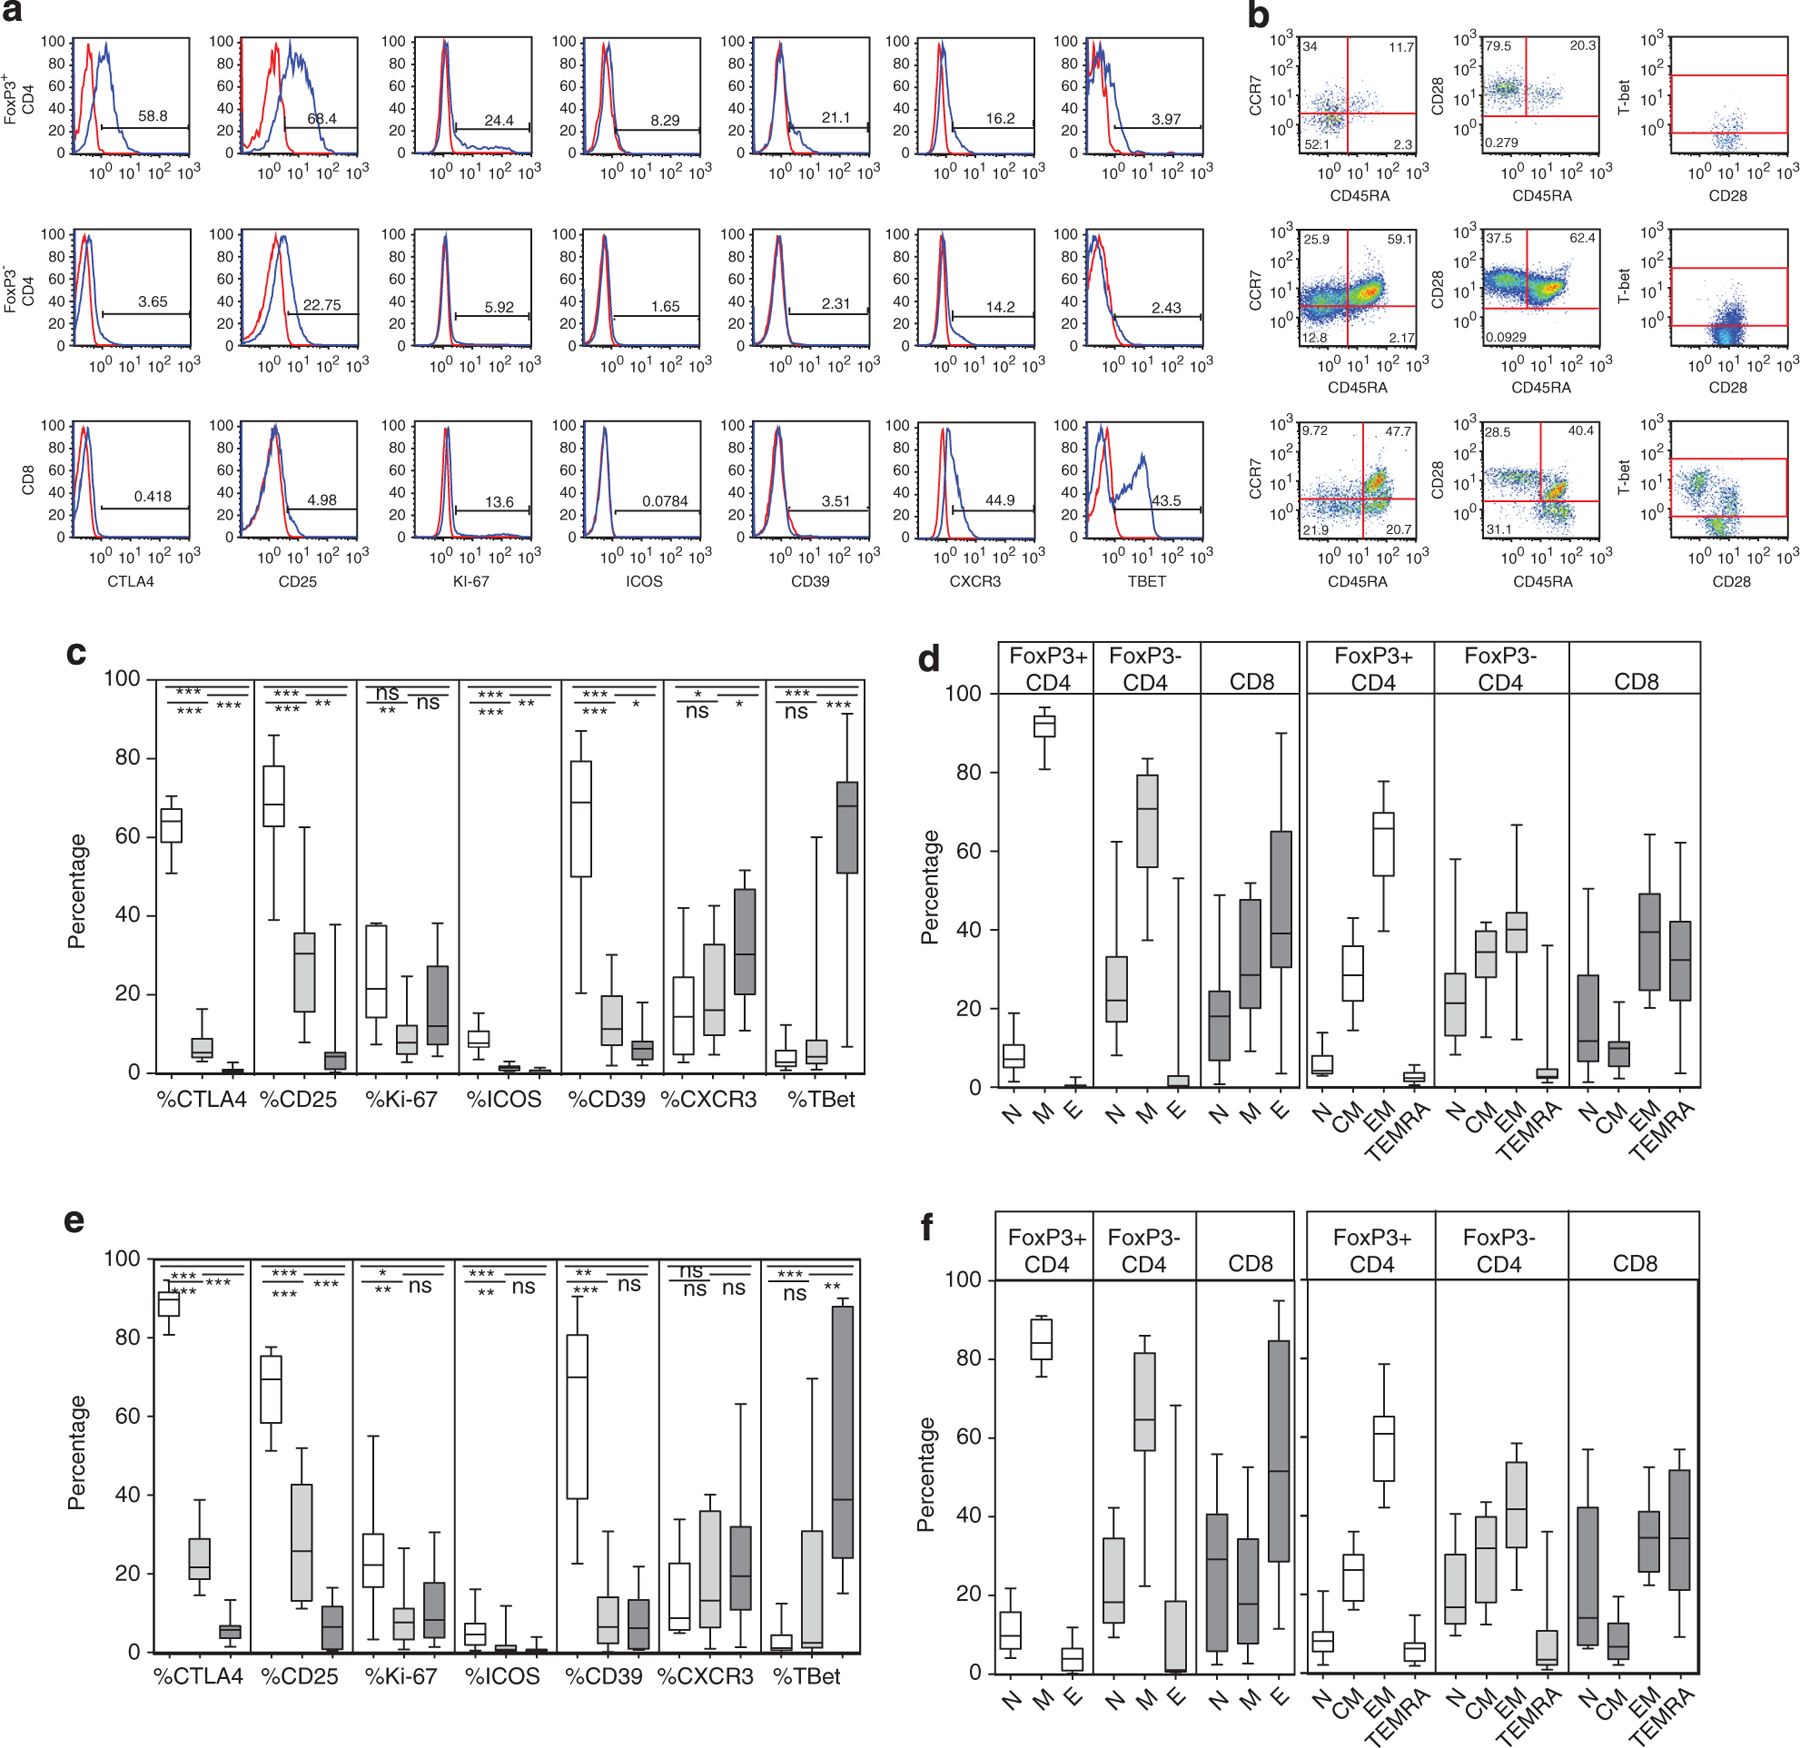
Comparison of peripheral blood Treg, non-Treg CD4 and CD8 cells. (a, b) Peripheral blood T cells were examined in 10 of the patients with severe lichenoid cGVHD affecting oral mucosa and skin and in 10 patients with sclerotic skin. A representative patient (no. 2) is shown. CD3+ T cells were gated on FoxP3+ CD4+, FoxP3− CD4+ and CD8+ T cells and assessed for markers of cytokine receptor expression (CD25), proliferation (Ki-67), naive, memory and effector status (CD45RA versus CCR7 and CD45RA versus CD28), Treg function (CTLA4, ICOS, CD39), transcription factors and chemokine receptors affecting trafficking to inflammatory sites (T-bet, CXCR3). Isotype controls for each marker shown in red. Percentage expression was determined relative to full-minus-one isotype control tubes for each Treg subset parameter. (c–f) The differential expression of these markers in the patient FoxP3+ CD4+ (white), FoxP3− CD4+ (light gray) and CD8+ (dark gray) populations were assessed in the lichenoid (c, d) and in the sclerotic (e, f) patients.