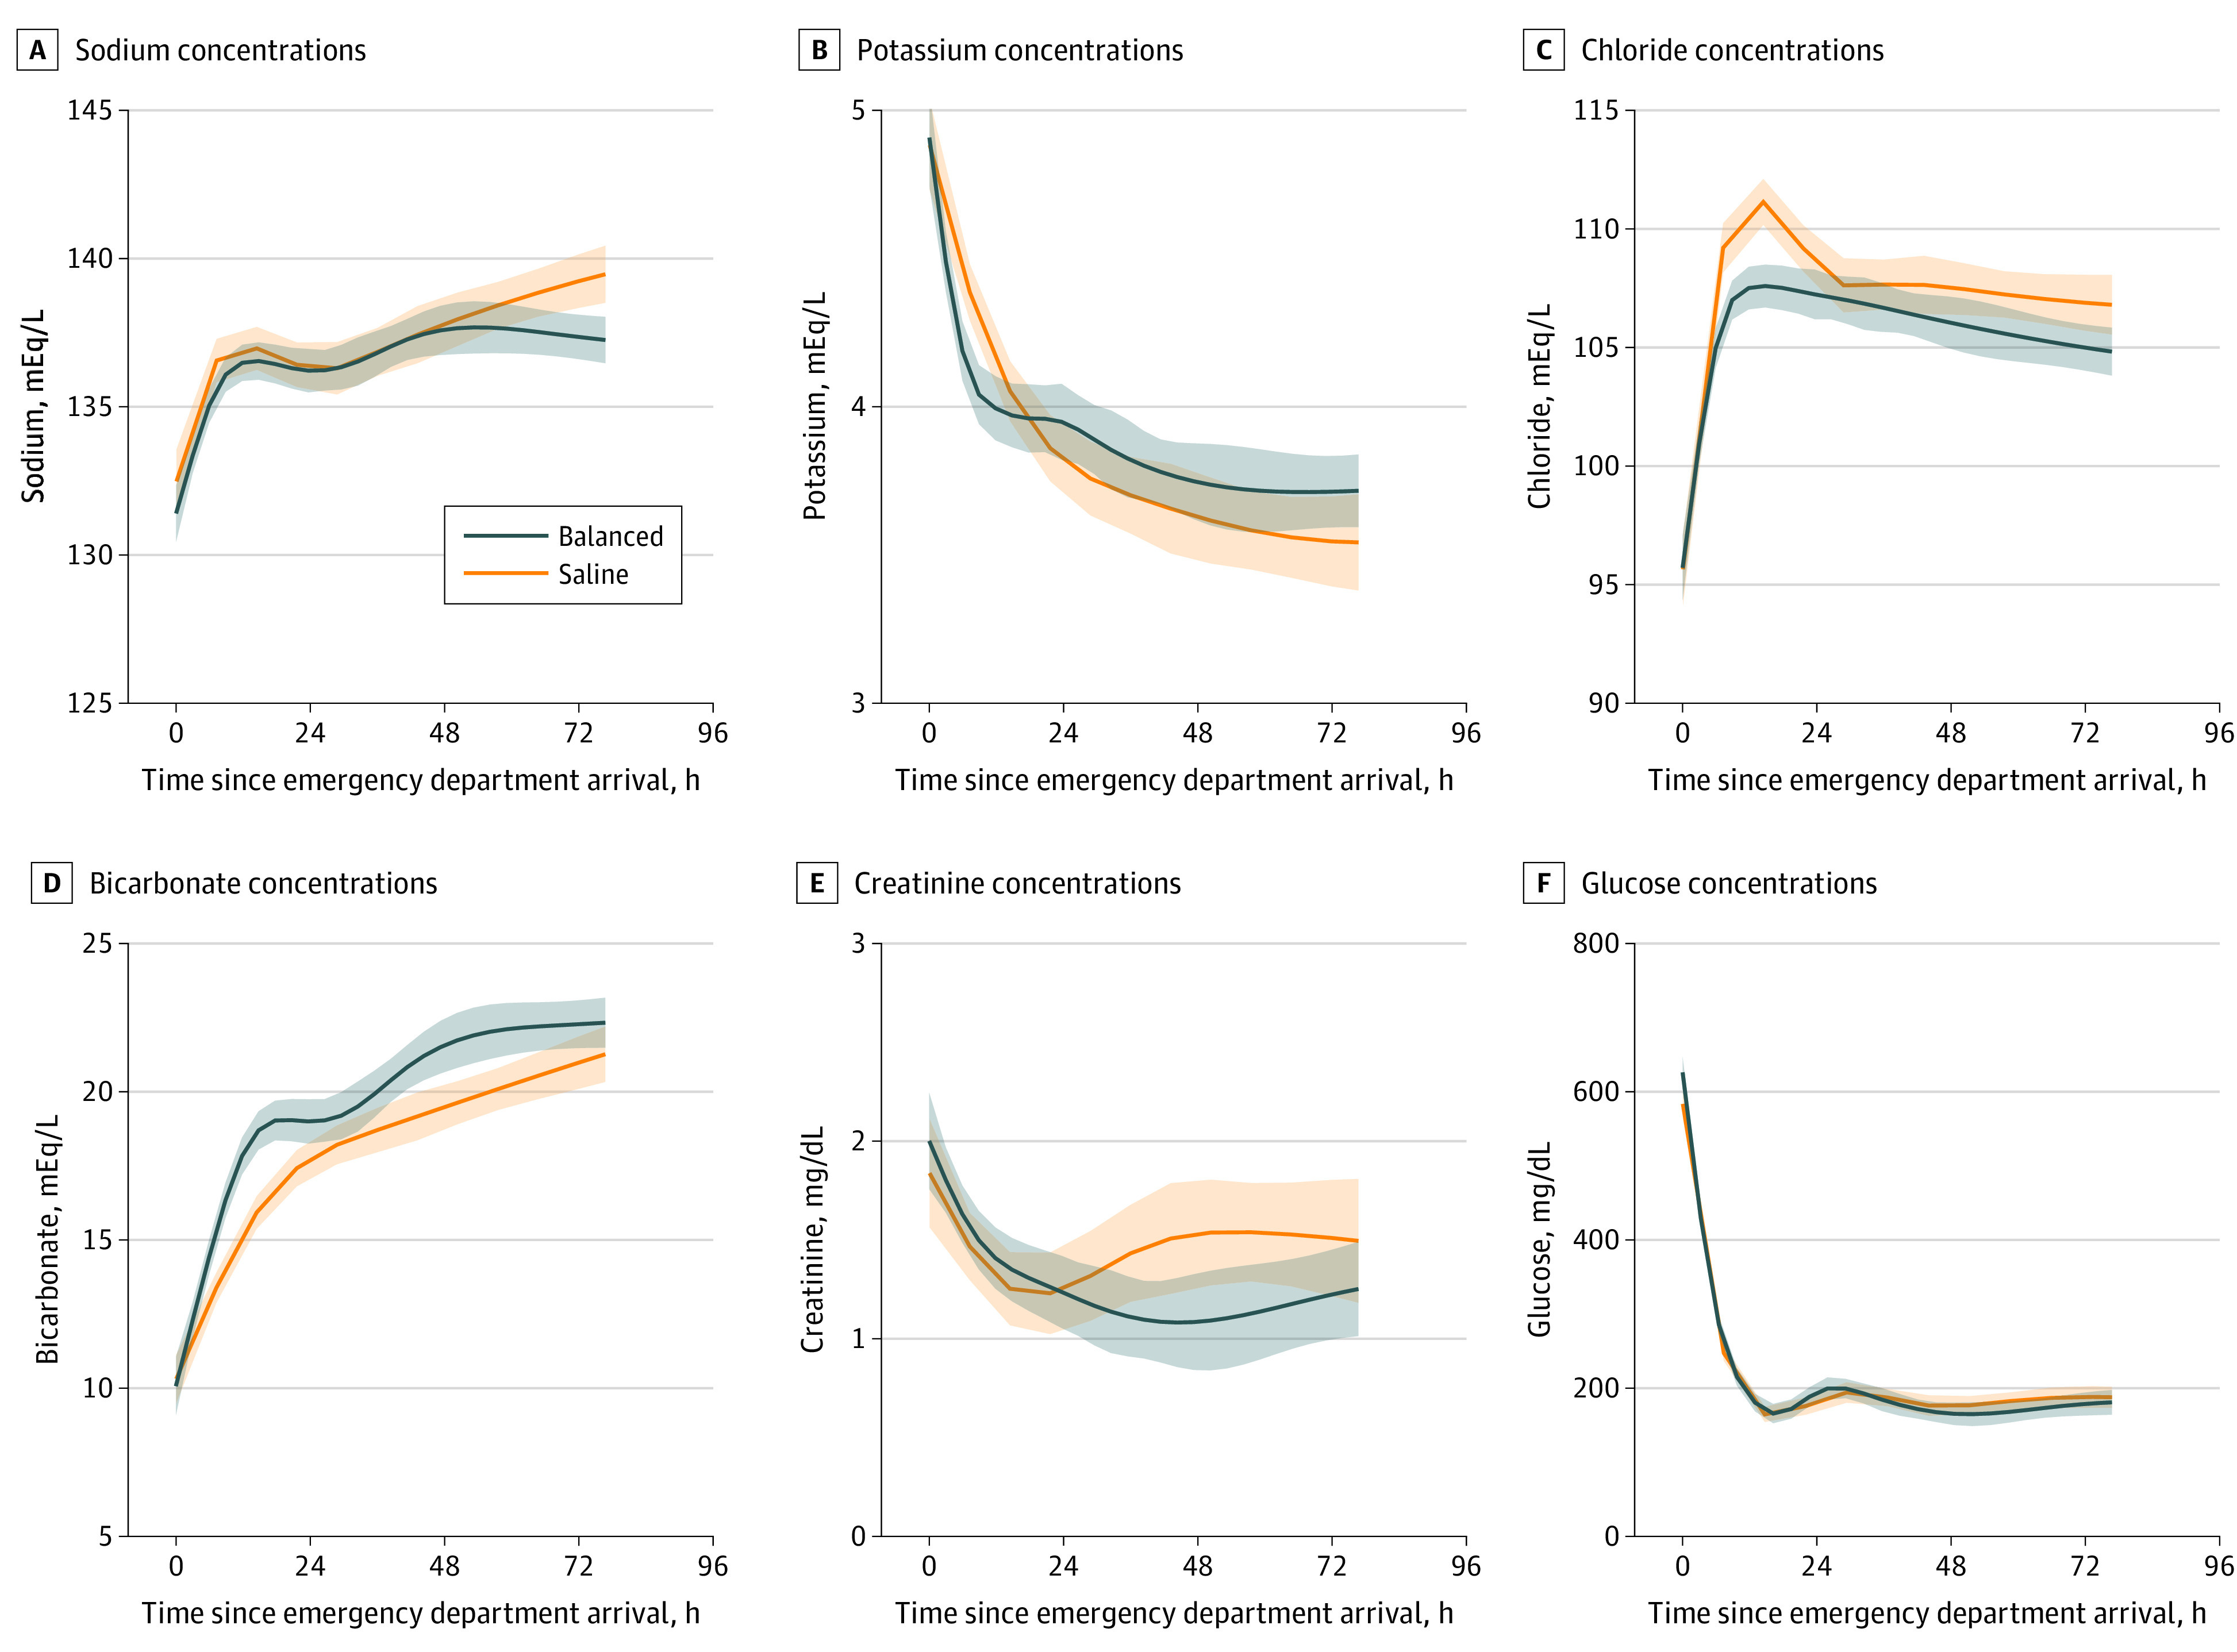
Figure 1. Plasma Electrolyte Concentrations in the First 72 Hours After Arrival in the Emergency Department by Assigned Treatment Group (Balanced Crystalloids vs Saline).

Graphs show concentrations of sodium (A), potassium (B), chloride (C), bicarbonate (D), creatinine (E), and glucose (F). Lines denote means, and shaded bands denote 95% CIs. Plots were created with locally weighted scatterplot smoothing. Patients were censored at the time of hospital discharge or death. Separation of 95% CIs for chloride and bicarbonate suggest significant differences between the balanced crystalloids and saline groups. SI conversions: To convert bicarbonate to millimoles per liter, multiply by 1.0; chloride to millimoles per liter, multiply by 1.0; creatinine to micromoles per liter, multiply by 88.4; glucose to millimoles per liter, multiply by 0.0555; sodium to millimoles per liter, multiply by 1.0; potassium to millimoles per liter, multiply by 1.0.
