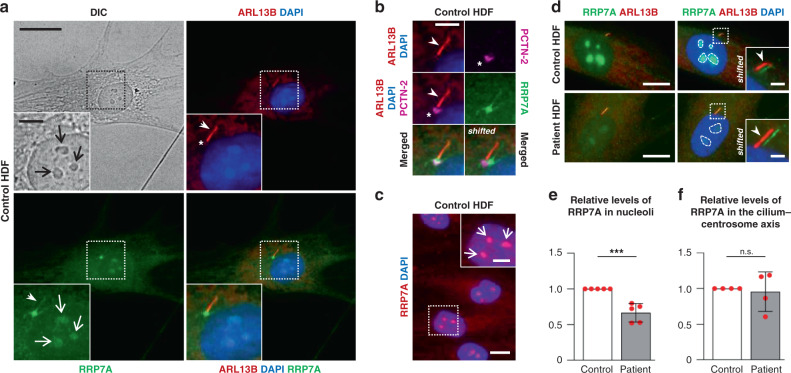
Fig. 4. RRP7A localizes to nucleoli, centrosomes, and primary cilia.
a IFM analysis on the localization of RRP7A (green) to nucleoli (open arrows, light microscopy (LM)), the primary cilium (closed arrows, ARL13B, red) in serum-depleted cultures of control human dermal fibroblasts (HDF). The nucleus (nu) is stained with DAPI (blue). Scale bar, 20 µm. Insert scale bar, 5 µm. b Zoomed image of the cilium-centrosome axis depicted in a with the ciliary base/centrosome marked with anti-Pericentrin-2 (asterisk, PCTN-2, magenta). Scale bar, 5 µm. c IFM analysis of localization of RRP7A (red) to nucleoli (open arrows) in serum-supplemented cultures. Scale bar, 20 µm. Scale bar in zoomed image, 5 µm. d IFM analysis on the localization of RRP7A (green) to nucleoli (stippled-lined areas) and the primary cilium (ARL13B, red) in serum-depleted cultures of control HDFs (left panel) and patient HDFs (right panel). Scale bars, 10 µm. The insert shows magnification of boxed areas with shifted overlays between RRP7A (green, closed arrow) and ARL13B (red, closed arrow). The nucleus (nu) is stained with DAPI. Scale bars, 2 µm. e Quantification of the relative levels of RRP7A in nucleoli in control and patient HDFs shown in d (control = 151 cells; patient = 125 cells, data average of n = 5 independent experiments; P = 0.0004). f Quantification of the relative levels of RRP7A at the cilium-centrosome axis in control and patient HDFs shown in d (control = 84, patient = 91, data average of n = 4 independent experiments;; P = 0.762). Data are represented as mean ± SD and significance was determined using an unpaired, two-tailed Student’s t test. ***P < 0.001, n.s.: not significant.

