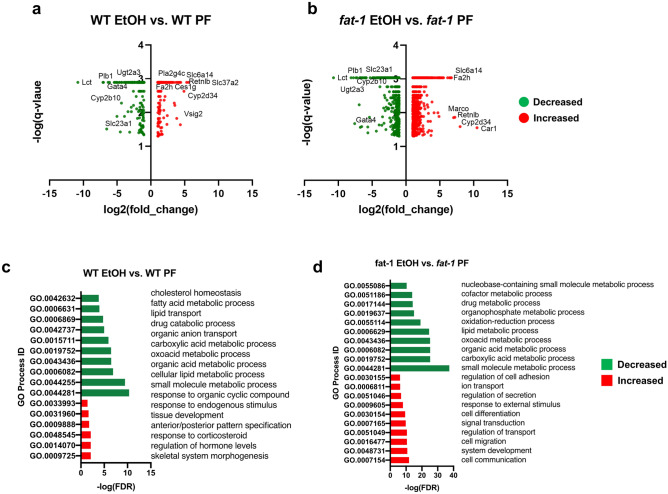
Figure 2.
Changes in intestinal transcriptional responses to EtOH in WT and fat-1 mice. (a) Volcano plot analysis of significant genes from the WT EtOH vs WT PF comparison plotted as log2(fold change) vs antilog(p-value) for individual genes. (b) Volcano plot analysis for the fat-1 EtOH vs fat-1 PF comparison plotted as log2(fold change) vs antilog(p-value) for individual genes. (c) GO Process analysis representative of genes decreased in expression (green) and genes increased in expression (red) for the WT EtOH vs WT PF comparison. (d) GO Process analysis representative of genes decreased in expression (green) and genes increased in expression (red) for the fat-1 EtOH vs fat-1 PF comparison. Significant DEGs that met a two-fold threshold were used for the analyses in (a–d). n = 3–5 mice per group.

