Figure 5.
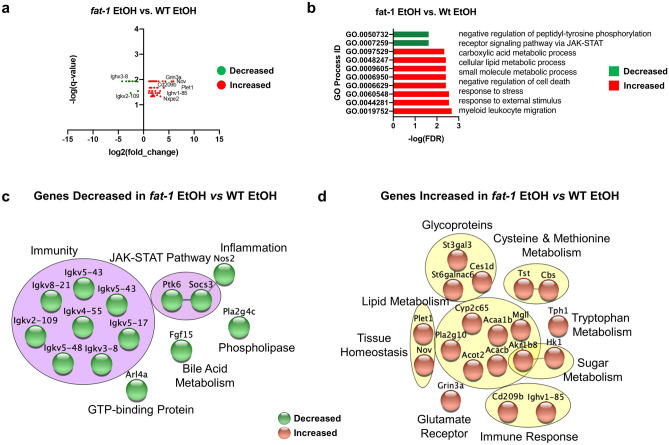
Differential transcriptional responses in fat-1 EtOH vs WT EtOH mice. (a) Volcano plot analysis of significant genes from the fat-1 EtOH vs WT EtOH comparison plotted as log2(fold change) vs. log(p-value) for individual genes. (b) GO Process analysis representative of genes decreased in expression (green) and genes increased in expression (red) from the fat-1 EtOH vs WT EtOH comparison. (c) Gene cluster analysis of genes decreased in the fat-1 EtOH vs WT EtOH comparison (purple circles, green nodes). (d) Gene cluster analysis of genes increased in the fat-1 EtOH vs WT EtOH comparison (yellow circles, copper nodes). Significant DEGs that met a two-fold change threshold were used for the analyses in (a–d). n = 3–5 mice per group.

