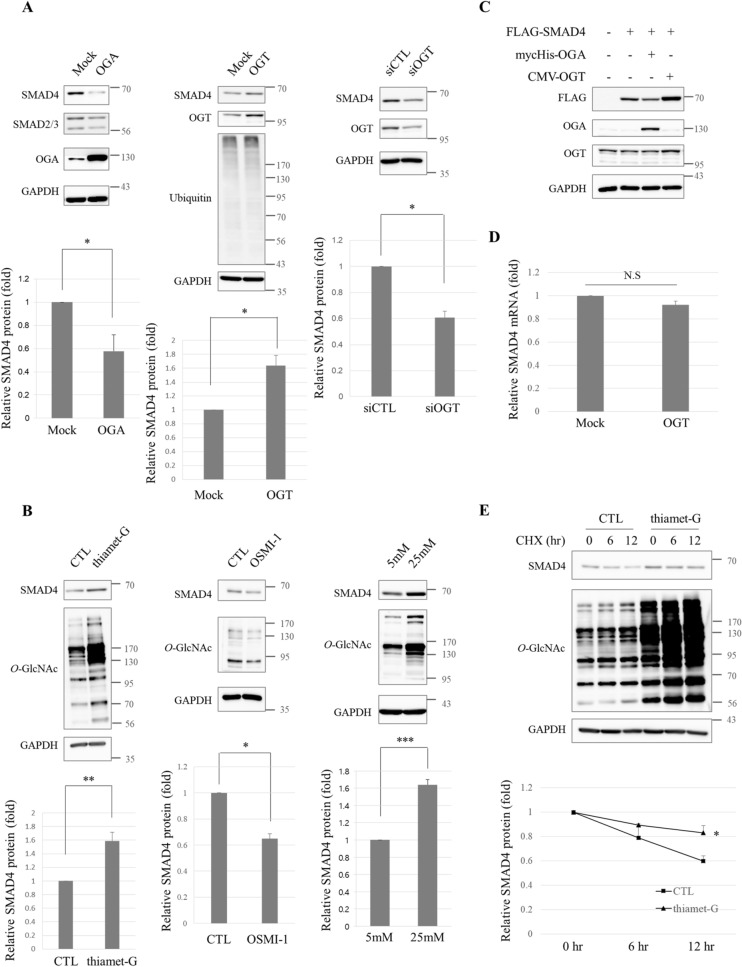
Figure 1.
The stability of SMAD4 is associated with cellular O-GlcNAc levels in human lung cancer cell lines. (A) Immunoblots showing dropped endogenous SMAD4 in myc-His-OGA-overexpressing A549 cells (left panel). Cells were transfected with the expression vector encoding myc-His-OGA and harvested after 36 h. Immunoblot analyses representing elevated endogenous SMAD4 in the presence of pCMV-OGT (middle panel). The plasmid-encoding pCMV-OGT was transfected into A549 cells for 24 h. siRNA-mediated knock-down of OGT and decreased endogenous SMAD4 in A549 cells (right panel). Cells were treated with small interfering RNA-targeting OGT for 48 h. Data are given as mean ± standard error from at least three independent experiments. The significance was *p < 0.05. P values were calculated by Student’s t test. Full-length blots are presented in Supplementary Fig. S4. (B) Immunoblots representing growth in endogenous SMAD4 and O-GlcNAc levels in thiamet-G-treated A549 cells for 48 h (left panel). The culture medium was supplemented with 10 μM thiamet-G every 24 h. Immunoblot analyses indicating a decline in endogenous SMAD4 and O-GlcNAc levels in OSMI-1-incubated A549 cells (middle panel). Control cells were incubated with DMSO. Immunoblots showing increased endogenous SMAD4 and O-GlcNAc levels in A549 cells cultured in 25 mM hyperglycemia (right panel). Cells were grown in 5 mM normoglycemia and in 25 mM hyperglycemia for 48 h. Data are given as mean ± standard error from at least three independent experiments. The significances were *p < 0.05, **p < 0.01, and ***p < 0.001. P values were calculated by Student’s t test. Full-length blots are presented in Supplementary Fig. S4. (C) Immunoblots showing the regulation of exogenous FLAG-SMAD4 on pCMV-OGT or myc-His-OGA overexpression. The plasmids encoding FLAG-SMAD4 were co-transfected with pCMV-OGT or myc-His-OGA into A549 cells for 24 h. Full-length blots are presented in Supplementary Fig. S4. (D) No significant difference in mRNA levels of SMAD4 were observed as measured by quantitative RT-PCR. pCMV-OGT-overexpressing A549 cells were prepared after 24 h of transfection. GAPDH was used for normalization. Data are given as mean ± standard error (n = 3). Relative SMAD4 mRNA levels used for statistical analysis are presented in Supplementary Table S1. (E) Half-life of SMAD4 in the absence and presence of thiamet-G, respectively. Note that SMAD4 had a longer half-life after thiamet-G treatment (upper panel). A549 cells were treated with 10 μg/ml CHX for the indicated time period after incubation with 10 μM thiamet-G for 48 h and then harvested. SMAD4 protein levels (lower panel). Data are given as mean ± standard error (n = 3). The significance was *p < 0.05. P values were calculated by Student’s t test. Full-length blots are presented in Supplementary Fig. S4.

