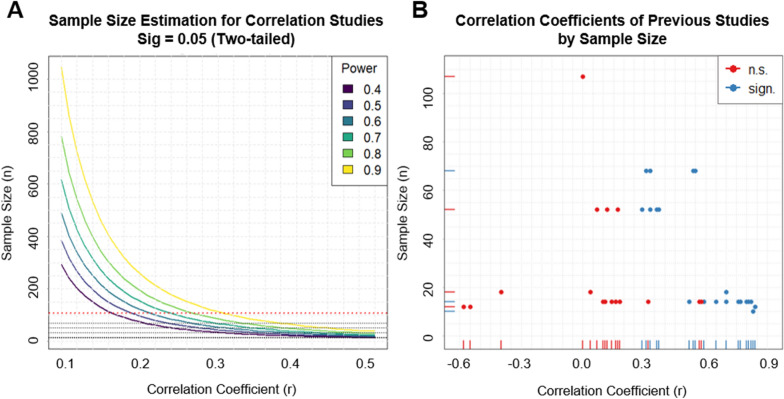
Figure 1.
Illustration of (A) estimated power of correlation studies given a certain sample size. Dotted grey lines indicate sample sizes of previous studies investigating differential or CS-specific associations with brain morphological measures. Note that in some previous studies regressions were performed rather than correlations. For comparability all effects size measures were transformed to correlation coefficients. The red line indicates the sample size of the current study. (B) Effect sizes expressed as correlation coefficients obtained in previous studies and the current study plotted by sample size. Note that in some previous studies regressions were performed instead of correlation. For comparability all effects size measures were transformed to correlation coefficients. Red dots indicate non-significant and blue dots indicate significant findings. Note that some studies report more than one association and are hence represented with multiple dots.

