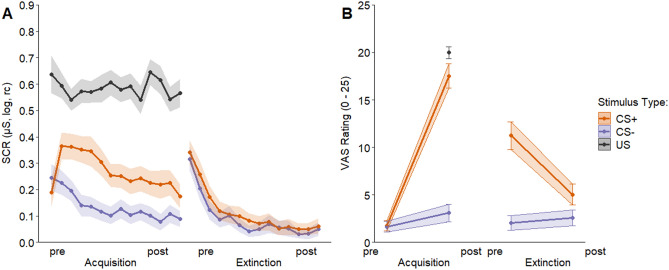
Figure 2.
(A) SCR to the CS+ as compared to the CS− as well as the US during acquisition and extinction training (illustrated trial-by-trial) as well as (B) fear ratings in response to CS+ and CS− prior to and after fear acquisition training and extinction as well as aversiveness ratings to the US after acquisition training. 95% confidence intervals are illustrated by coloured bands. Note that a linear learning process is not assumed, the lines are meant to facilitate the visualization of the general trend from pre to post acquisition and extinction.

