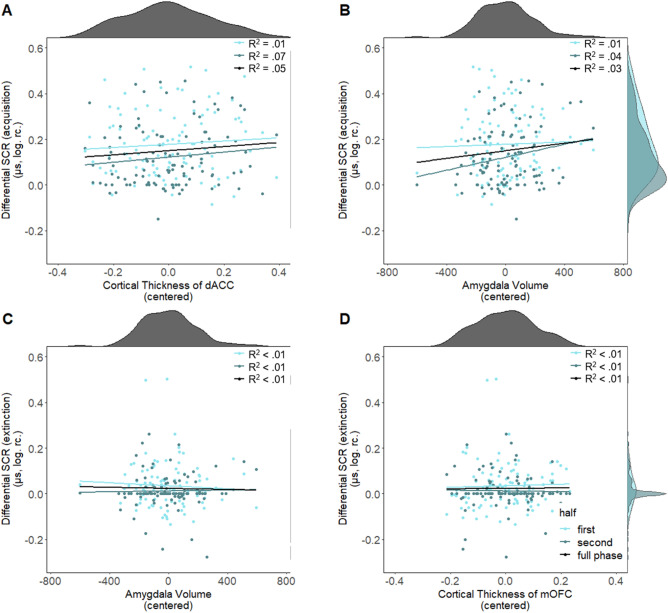
Figure 5.
Scatterplots with marginal densities illustrating the (absence of) associations between average differential SCR [(CS+) − (CS−)] during acquisition training (illustrated also for the first and second half of acquisition separately) and (A) cortical thickness of the dACC and (B) amygdala volume as well as between differential SCR [(CS+) − (CS−)] during extinction (illustrated also for the first and second half of acquisition separately) and (C) amygdala volume as well as (D) cortical thickness of the mOFC. Data points are color-coded depending on the first half (light blue), second half (blue).

