Figure 4.
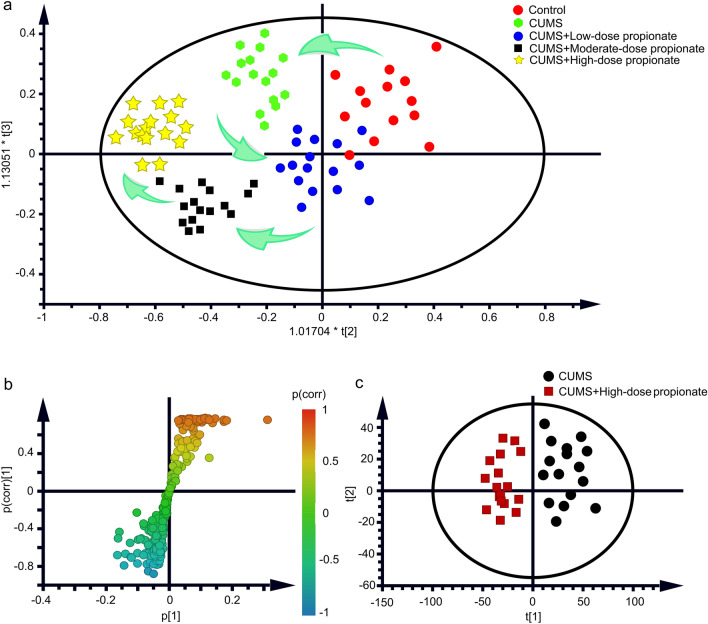
Metabolomic profiling of the CUMS rats receiving propionate administrations. (a) Principle component analysis (PCA) of the healthy control rats, the CUMS rats, and the CUMS rats receiving low/moderate/high-dose propionate. Red dots represent the healthy control group, green dots represent the CUMS group. Blue dots represent the group of CUMS rats receiving low-dose propionate. Black blocks represent the group of CUMS rats receiving moderate-dose propionate. Yellow stars represented the group of CUMS rats receiving high-dose propionate. Green arrows represented the trajectories of principle components. (b) S-plot analysis between the CUMS group and the CUMS + High-dose propionate group. (c) Score plot of Orthogonal Projection to Latent Structures Discriminant Analysis (OPLS-DA) between the CUMS group and the CUMS + High-dose propionate group.

