Figure 1.
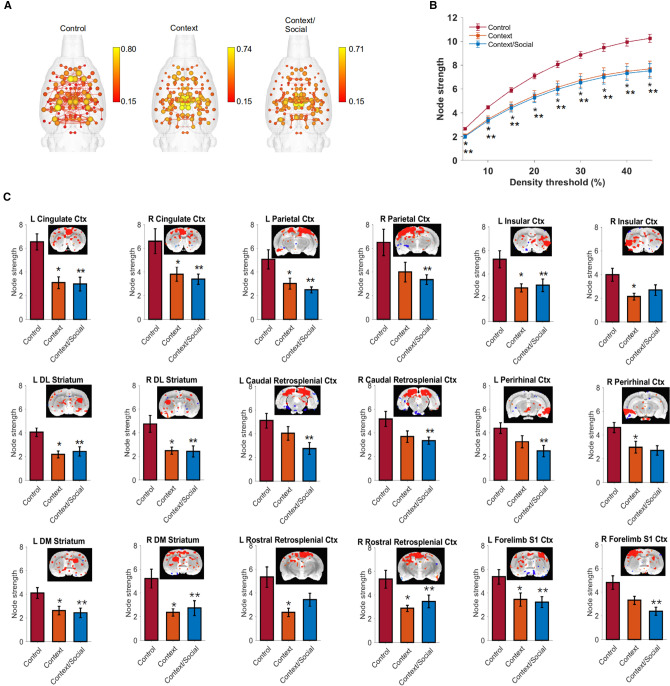
Presentation of a familiar context or context with social interaction prior to imaging resulted in significantly reduced node strength in cortical regions involved in memory. (A) Connectome maps with anatomically-placed nodes scaled by strength (edges are normalized Pearson’s r thresholded at 0.15). Scale bar represents edge weight values. (B) Global node strength at different graph edge densities. (C) Local node strength was reduced bilaterally in cortical regions and striatum. Additional regions with unilerateral reductions in node strength are summarized in the results section. Functional connectivity maps at level seed location and overlaid onto T2 template are shown above bar graphs. Data are mean ± standard error. *Context and **context/social group significantly different from control (ANOVA with Tukey–Kramer post hoc test). Abbreviations: DM, dorsomedial; DL, dorsolateral; L, left; R, right; Ctx, cortex; S1, primary somatosensory.

