Figure 2.
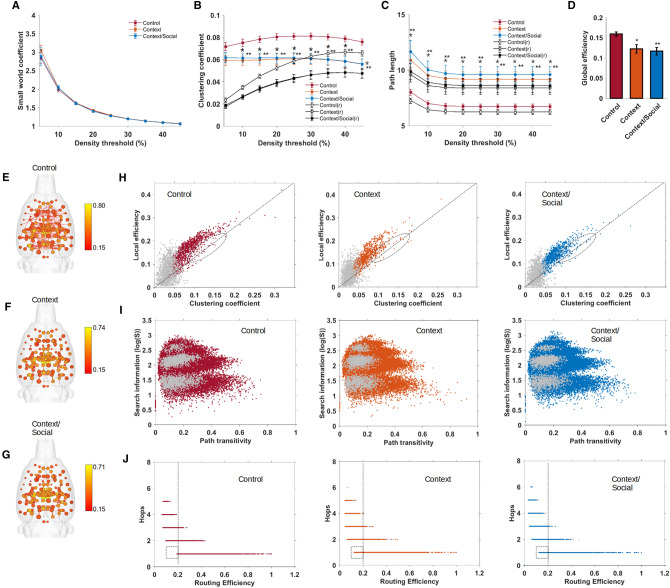
Global efficiency is reduced by context and context/social exposure. (A) Small world index at various densities. (B) Clustering coefficient at various densities. (C) Characteristic path length at various densities. (D) Global efficiency at a threshold of 10%. (E–G) 3D connectome maps with nodes scaled by local efficiency in control (E), context exposed (F), and context/social exposed (G). Sale bar represent edge weights values (Pearson r threshold 0.15). (H) Distribution of local efficiency vs. clustering coefficient values for all nodes and all subjects in control, context and context/social exposed rats. (I) Distribution of search information vs. path transitivity values for all edges and all subjects in control, context and context/social exposed rats. (J) Distribution of number of steps or hops between node pairs vs. routing efficiency values for all edges and all subjects in control, context and context/social exposed rats. Matrix density threshold for (D–J) is 10%. In (B,C), blue, orange, red line plots are for randomized (r) versions of functional connectivity matrices. In (H–J), gray color dots represent data points for nodes or edges of randomized graphs. Data are mean ± standard error. *Context and **context/social group significantly different from control (ANOVA with Tukey–Kramer post hoc test).

