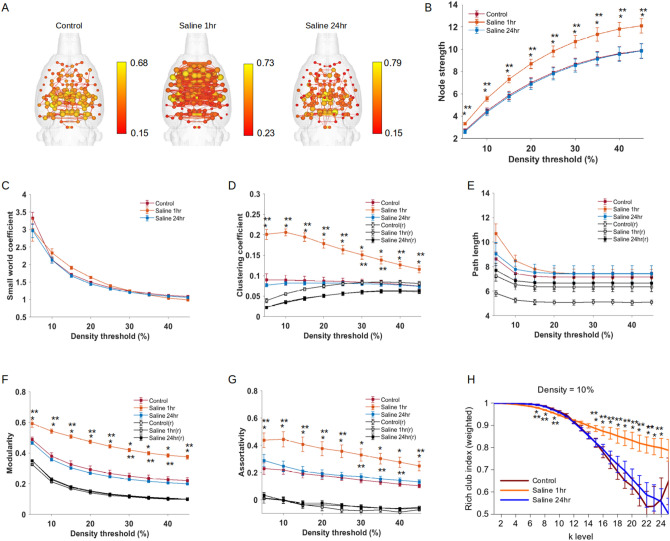
Figure 4.
Functional connectome changes in response to an arousing stimulus administered to rats at the same temporal delay prior to imaging as the context and social/context exposures. The arousing stimulus was a manual handling procedure during administration of an intraperitoneal injection of sterile physiological saline solution. (A) Connectome maps (network density = 10%) with anatomically-placed nodes scaled by strength (edges are normalized Pearson’s r thresholded at 0.15). Scale bar represents edge weight values. (B) Global node strength at various graph densities. (C) Small world index at various graph densities. (D) Clustering coefficient at various graph densities. (E) Characteristic path length at various graph densities. (F) Modularity at various graph densities. (G) Assortativity index at various graph densities. (H) Rich club curve at a 10% graph edge density. In (B–G), blue, orange, red line plots are for randomized (r) versions of functional connectivity matrices. Data are mean ± standard error. *Context and **context/social group significantly different from control (ANOVA with Tukey–Kramer post hoc test).

