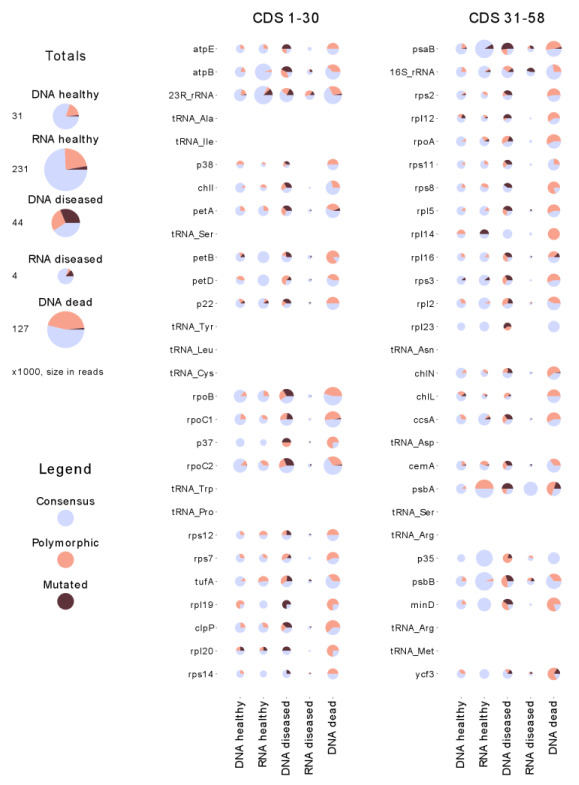
Figure 1. Relative proportion of polymorphic sites in the chloroplast genome of sponge symbionts, for the five samples studied.

The results for each of the annotated genes are shown on the right. The left column presents the integrated results for each sample. The proportions of polymorphic sites and sites with high levels of alternative alleles (‘mutations’) are shown as pie charts, relative to the total number of polymorphic sites in all samples. The proportion of sites which are polymorphic in some other samples, but not in the given sample, are shown in light blue. The legend on the left shows the colour scheme used to represent three types of site. The circle radius represents the total number of sequencing reads aligned to the gene segment and used to identify polymorphic sites. The scale of the circle radii is transformed for better appearance, to compensate for the high variation in the number of aligned reads.
