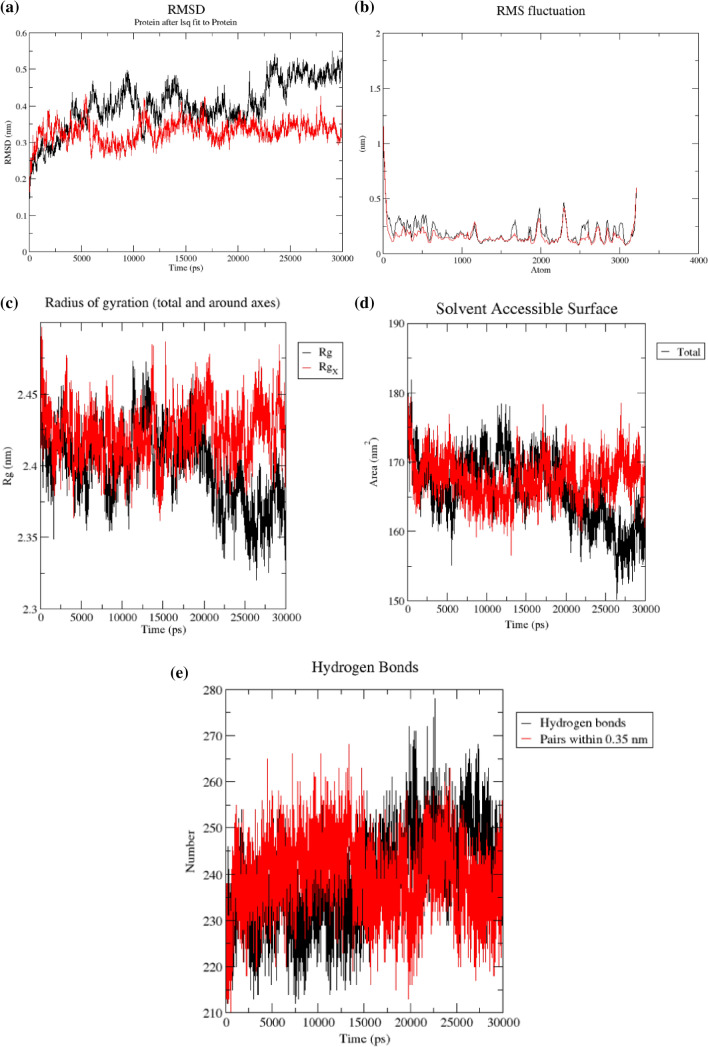
Fig. 3.
a The RMSD of the backbone atom of 3e9s (SARS-CoV PLpro) in Apo (red) and bound state (black) over a time period of 30 ns denoting a value of 4.4 Å, b RMSF plot of backbone atoms of 3e9s (SARS-CoV PLpro) in Apo and bound state over a time period of 30 ns, c Radius of gyration (Rg) plot of Apo SARS-CoV PLpro (Black) compared to complexed state (Red) for 30 ns Simulation, d solvent accessible surface (SASA)of STOCK1N-69160 bound PLpro complex with respect to the unbound (apo) reference structure, e The total number of the hydrogen bonds produced during the simulation period of 30 ns

