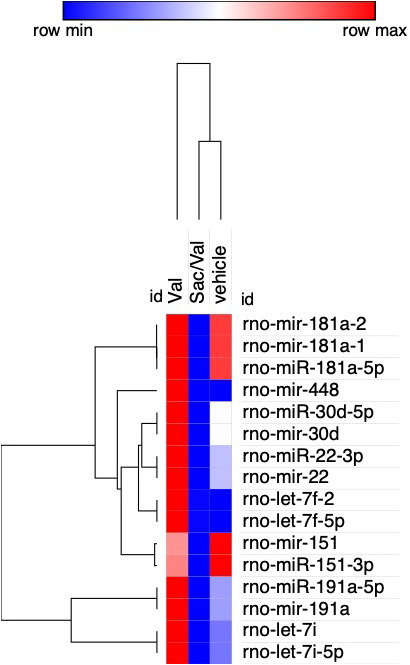
Figure 4. Heatmap of hierarchical clustering of the top 15 differentially expressed miR in the sacubitril/valsartan (sac/val), valsartan (val), and vehicle treatment groups.

rno‐miR‐181a‐1, rno‐miR‐181a‐2, and rno‐miR‐181a‐5p demonstrate the highest expression difference between the exosomes derived from the plasma of sacubitril/valsartan–treated vs valsartan‐treated and vehicle‐treated rats. Red denotes high and blue denotes low expression levels.
