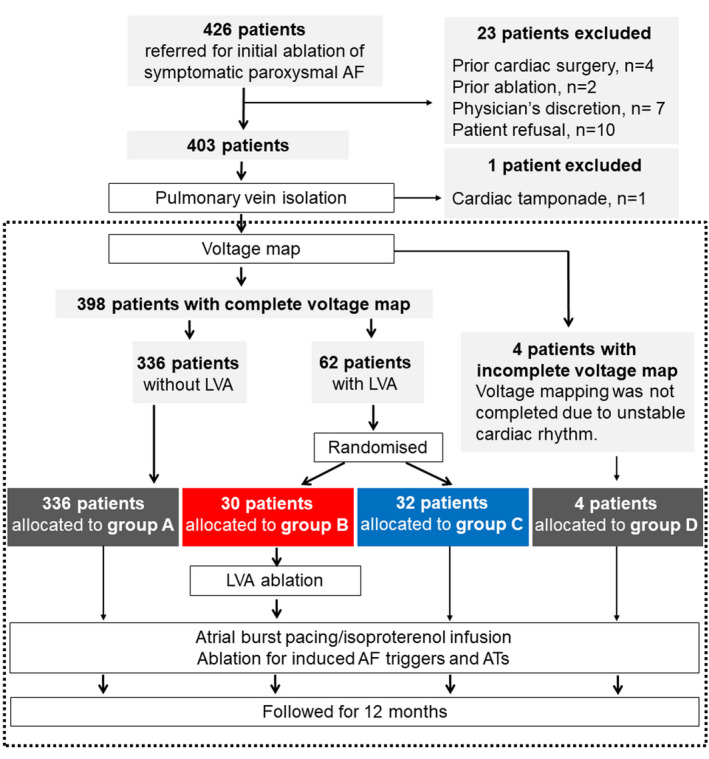
Figure 1. Patient flowchart.

Final patient enrollment was 402 patients, as framed by a dashed rectangle. Among 398 patients in whom voltage mapping was completed, 332 patients had no low‐voltage area (group A). The remaining 62 patients had low‐voltage areas after pulmonary vein isolation and were randomly allocated to undergo low‐voltage area ablation (group B) or not (group C). Voltage mapping was not completed in 4 patients (group D) because of unstable heart rhythm. AF indicates atrial fibrillation; AT, atrial tachycardia; LVA, low‐voltage area.
