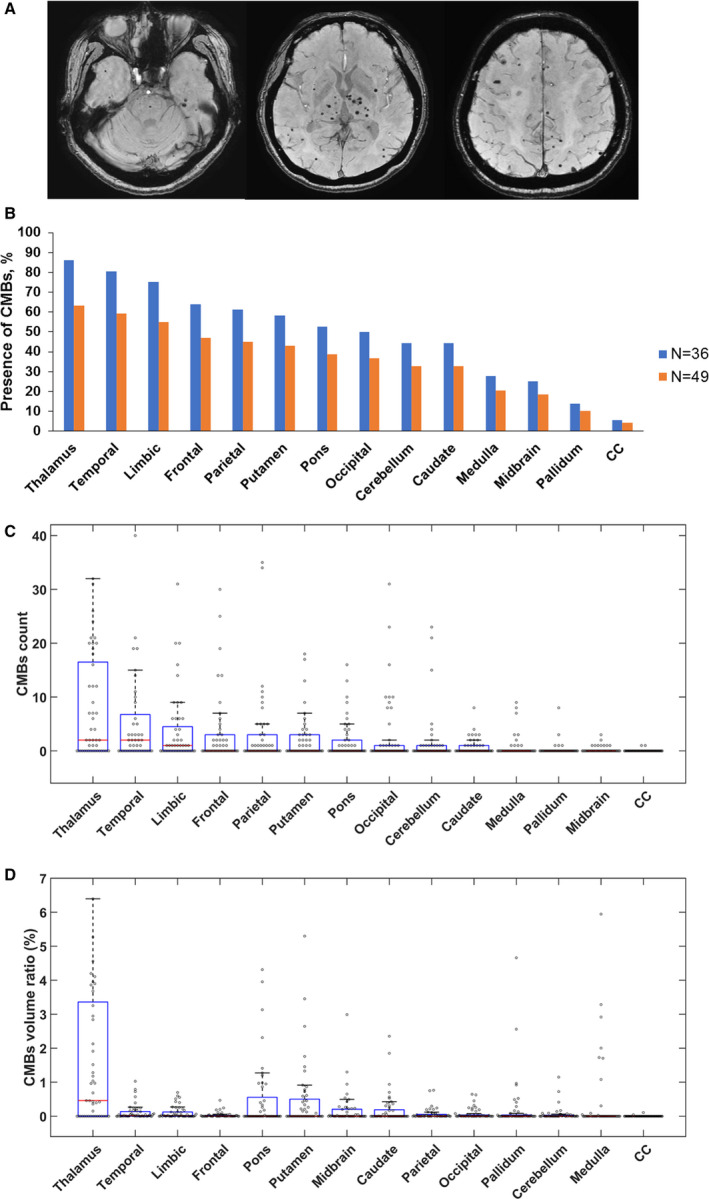
Figure 1. Cerebral microbleed (CMB) burdens in the NOTCH3 cysteine‐altering mutation carriers in the present study.

A, Representative susceptibility‐weighted imaging of a 62‐year‐old woman carrying NOTCH3 p.R544C mutation with initial presentation of lacunar infarct at the age of 57 years. B, Percentage of subjects with CMBs in the 14 brain regions. Orange bar: all study participants in the present study (N=49); blue bar: study participants with at least 1 CMB in the whole brain (N=36). CMB counts (C) and CMB volume ratios (D) in the corresponding brain regions in all study participants were illustrated by the box plots with whiskers with maximum 1.5 interquartile range (N=49). CC indicates corpus callosum.
