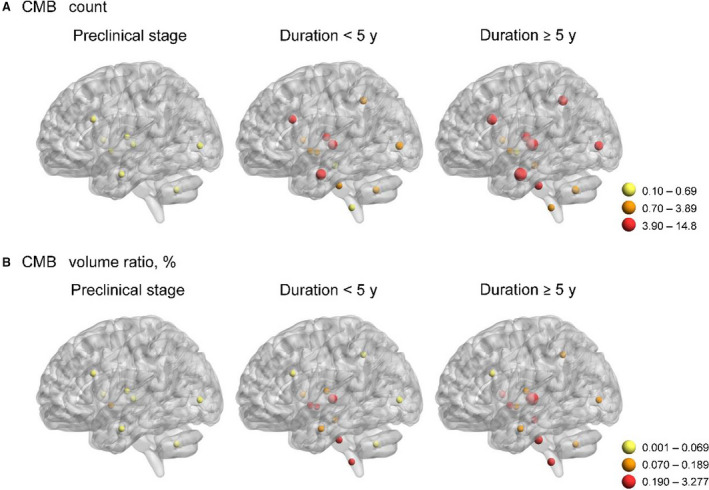
Figure 2. Cerebral microbleed (CMB) burdens in the NOTCH3 cysteine‐altering mutation carriers at different disease stages.

A, Yellow dots represent regions with average CMB count of 0.10 to 0.69. Orange dots represent regions with average CMB count of 0.70 to 3.89. Red dots represent regions with average CMB count of 3.90 to 14.8. B, Yellow dots represent regions with average CMB volume ratio of 0.001% to 0.069%. Orange dots represent regions with average CMB volume ratio of 0.070% to 0.189%. Red dots represent regions with average CMB volume ratio of 0.19% to 3.28%.
