
FIG 2.
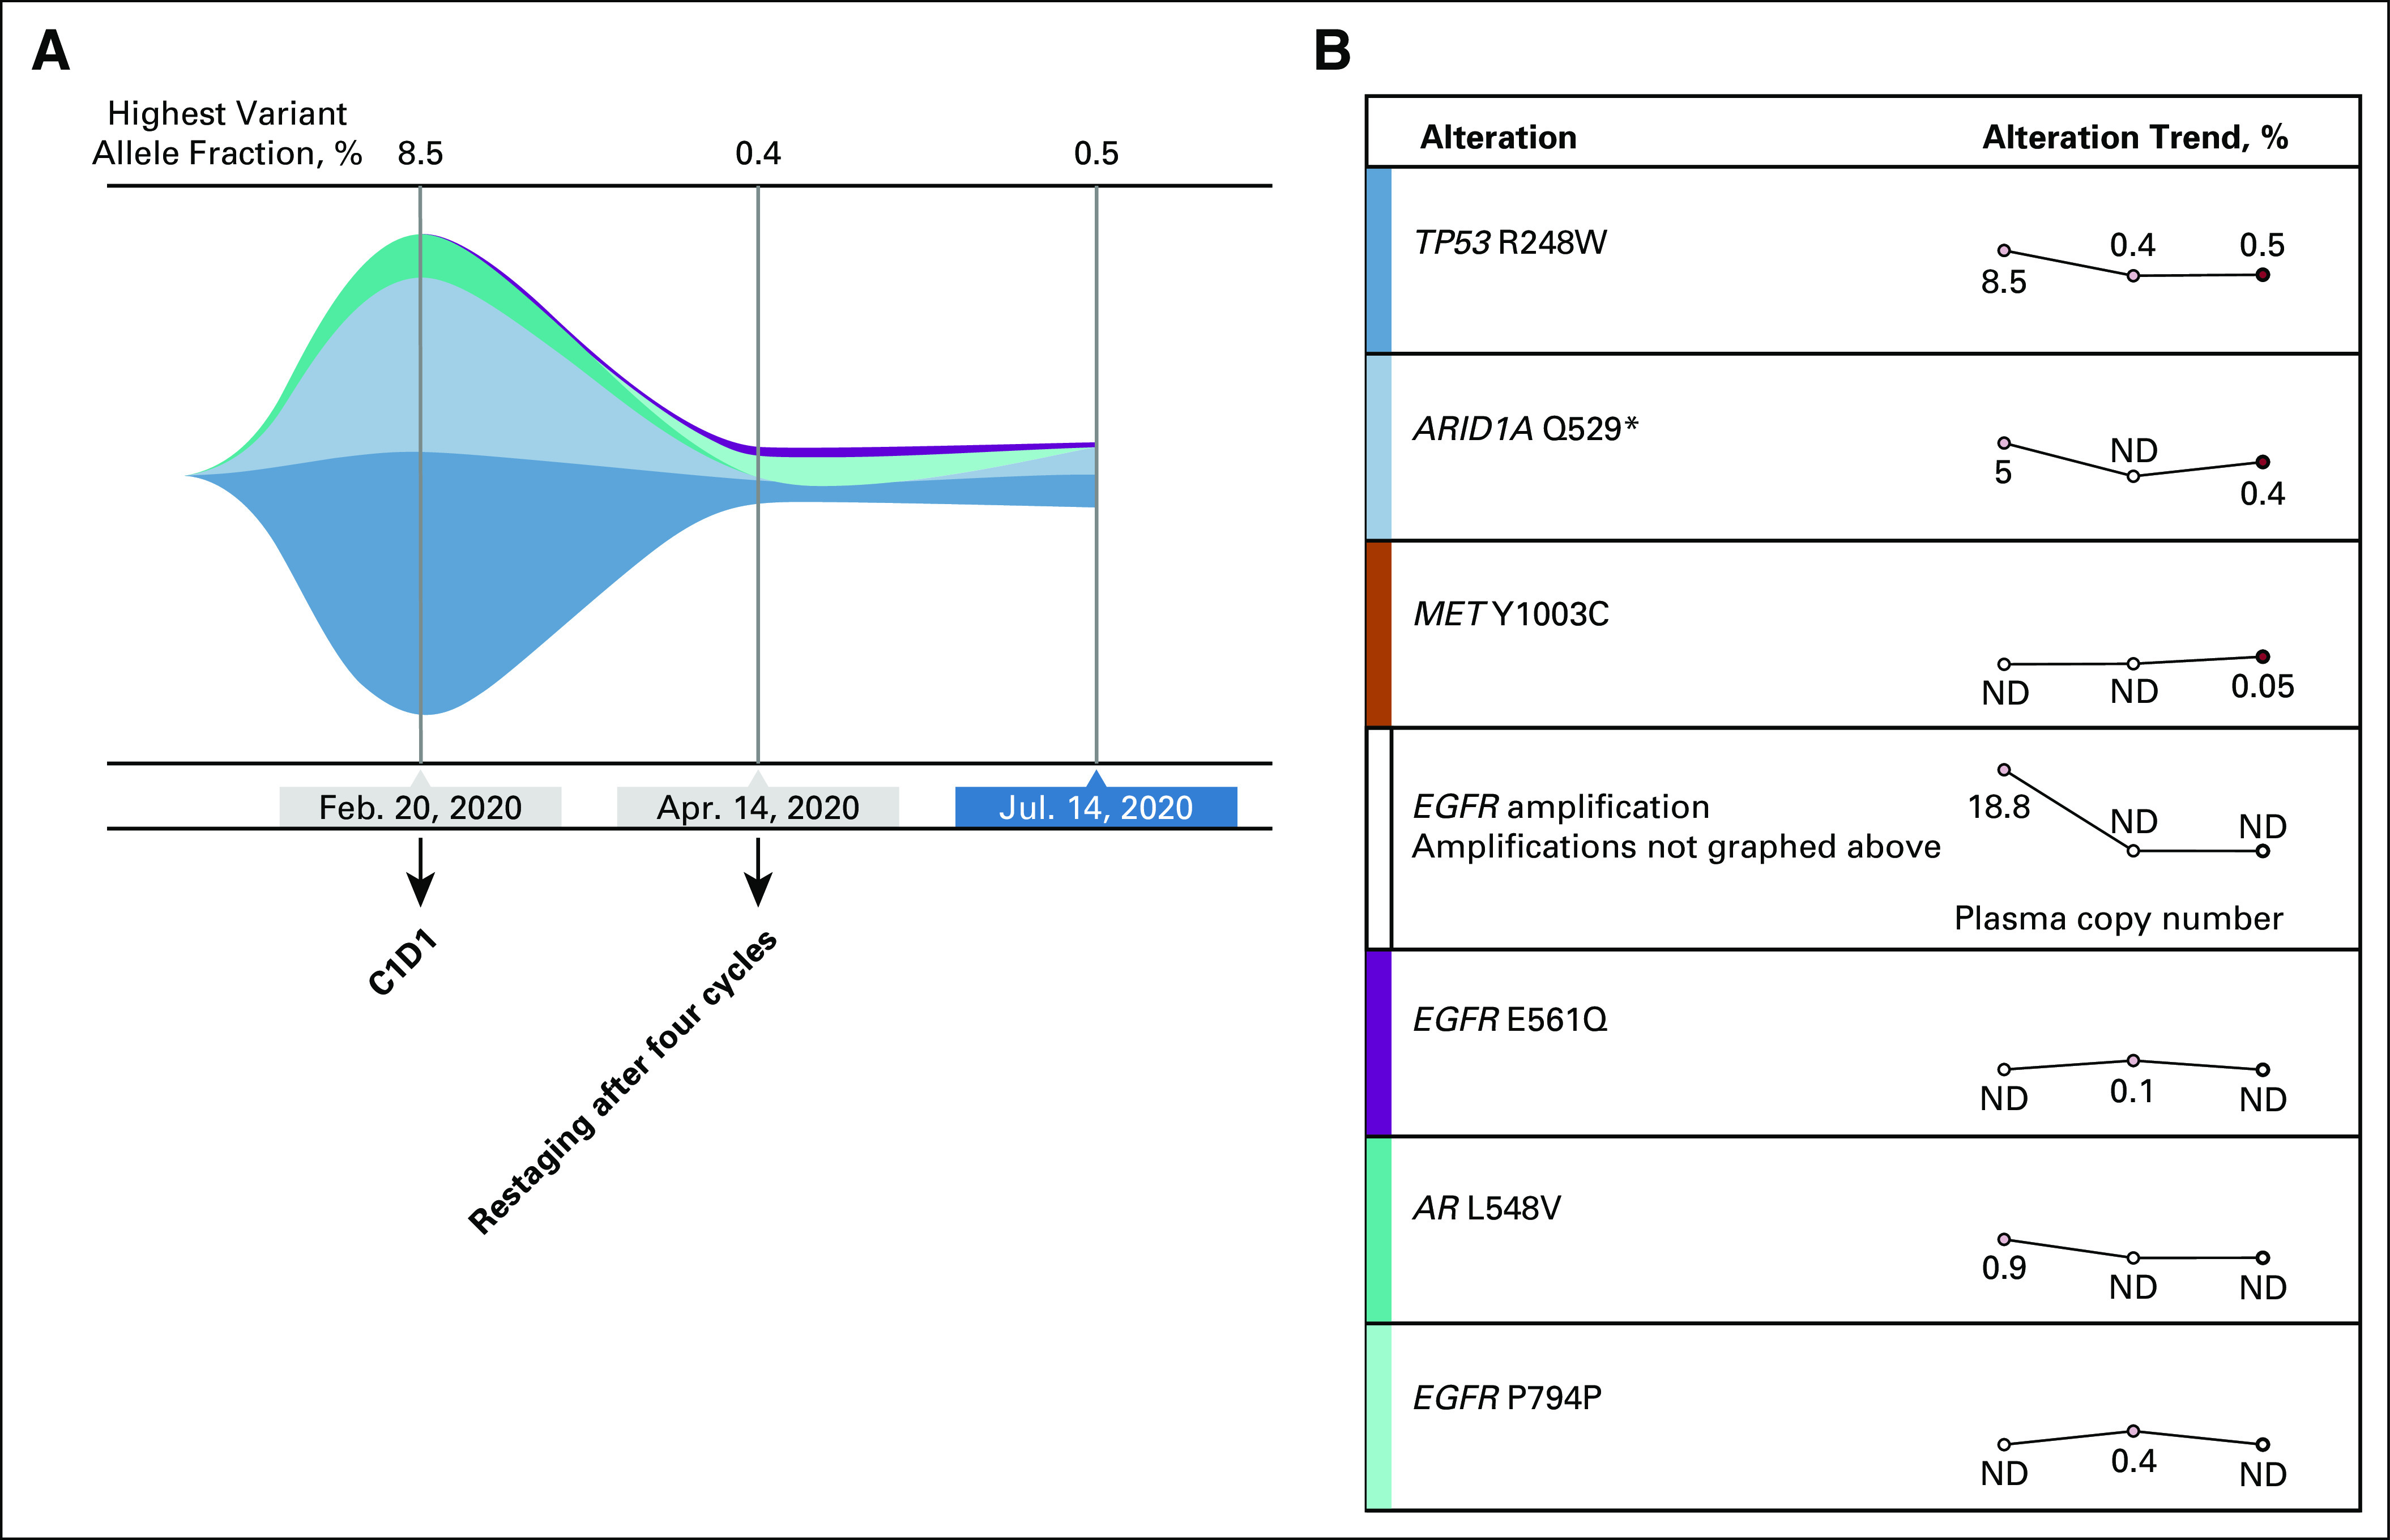
Circulating tumor DNA analysis before and after cetuximab and nivolumab therapy. (A) Tumor response map with trends in mutation allele frequency. (B) Trends over the same time points of the specific genomic events. C1D1, cycle one day 1 of therapy; ND, not detected.