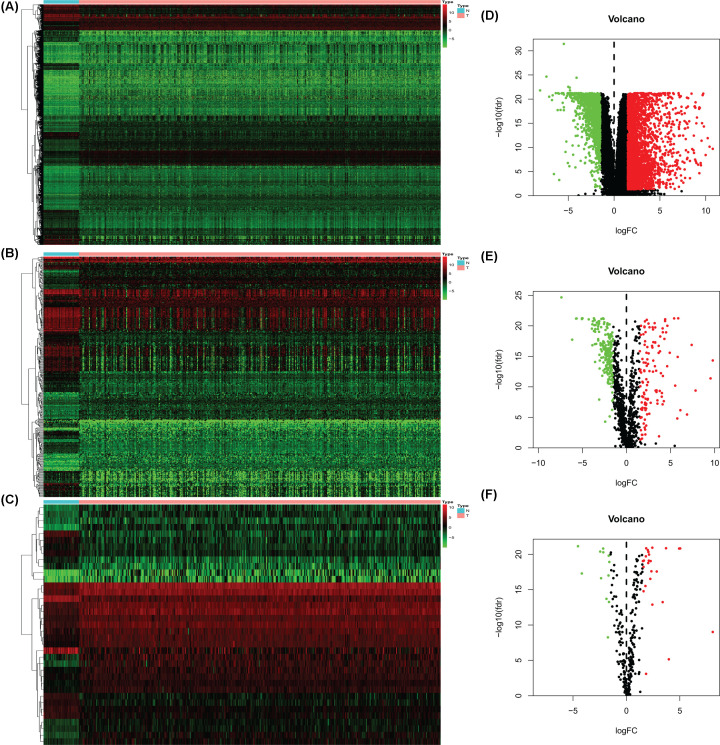
Figure 1. Differentially expressed genes, IGs, and TFs in TCGA-COAD.
Heatmaps: DEGs (A), DEIGs (B), and DETFs (C); higher expression manifested in red; lower expressions were green. Volcano diagrams: DEGs (D), DEIGs (E), and DETFs (F); each point represents a gene. Down-regulated (green), up-regulated (red), and no significance DEGs, DIEGs, DTFs (black). IGs, immune genes; TFs, transcription factors;TCGA, The Cancer Genome Atlas; COAD,colon adenocarcinoma; DEGs, differentially expressed genes;DEIGs, differentially expressed immune genes; DETFs, differentially expressed transcription factors.

