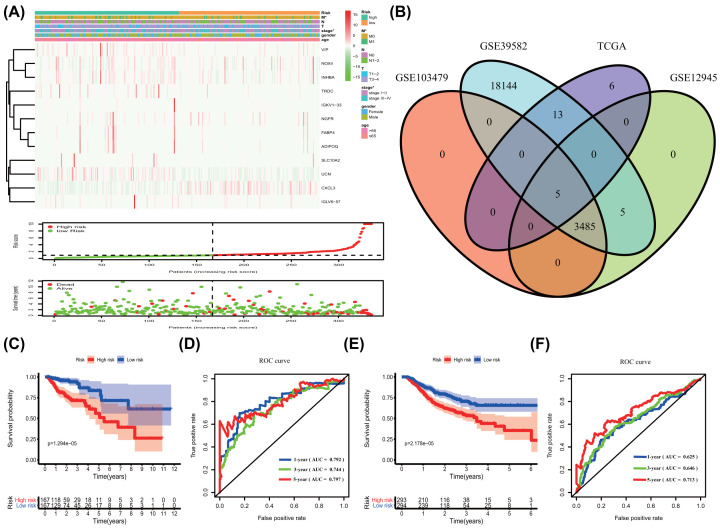
Figure 2. Prognosis model of IGs and survival analysis.
(A) Heatmap of the immune-associated gene expression profiles in prognostic signature for TCGA-COAD. The distribution of risk score and patient’s survival time, as well as the survival status of TCGA-COAD. The black dotted line is the optimum cutoff dividing patients into low- and high-risk groups. * represented P<0.05. (B–F) Kaplan–Meier survival analysis of COAD patients ranked by the median risk score. The high-risk score was related to poor OS in training group (C) and test group (E). ROC analysis of the sensitivity and specificity of the OS in training group (D) and test group (F). OS, overall survival; ROC, Receiver Operating Characteristic.

